SportsShoes Running Report: Running Statistics 2026
The year has started, and we’re back again taking a look at all things running, and dissecting how we’re all feeling about lacing up our trainers in the year ahead.
ㅤ
2025 was a year of huge change, and the fitness industry was no stranger to it. In the last 12 months alone, we saw record-breaking race entries, younger generations continue to prioritise fitness over drinking, and a desire for community and connection nearly quadruple the number of new run clubs, according to Strava.
ㅤ
We’re in the third year of publishing our annual Running Report (you can read 2025’s and 2024’s here), and with a mission to help our customers lead happier and healthier lives, there’s nothing we love more than diving into the data to see how Brits are really engaging with running. Using a combination of nationally representative survey data, research from YouGov, as well as global search data, this year’s report explores participation levels, running habits and motivations and the competitive running landscape.
ㅤ
We also examine perceptions of safety when running in public, injury risk, and how runners are and aren’t training. By understanding not just who does and doesn’t run, but why many don’t engage with running, this report aims to understand the barriers to running and how greater support could help make the sport more truly accessible.
ㅤ
Whether you’re taking to the trail for the first time, or you’re a seasoned runner wanting to up your game - we hope you find the report insightful.
ㅤ
What Have We Looked At This Year?
ㅤ
How Many People Run in the UK?
In Numbers:
• 17% of Brits say they run outdoors at least once a month, either on the road, trail, track or cross country
• 6% of the UK population want to start running in 2026
• Men are more likely to run (23%), than women (15%)
• Gen Z (aged 18-28) and millennials run more regularly than any other generation (27% and 30%, respectively)
• 15% of runners say they run with their dogs
• One in 10 (11%) of runners who run up to 5k never time their runs
ㅤ
ㅤ
Over one in six (17%) of the UK population say they run outdoors at least once a month - this includes various types of runs, such as a parkrun at the weekend, a short jog on the pavement or trail run. Running continues to be one of the lowest-cost and most accessible ways to stay fit, with those getting into the sport needing only a decent pair of running shoes and something comfortable to wear - and it appears this sentiment is becoming shared by more people, with an interest in running more increasing year-on-year. Back in 2023 just 8% said they were keen to start running more in 2024, in 2024 this jumped to 13% and as of 2025 it’s 18%.
ㅤ
In fact, 6% of Brits who don’t already run, say they want to start in 2026. This equates to about 4.6 million people according to current ONS statistics.
ㅤ
Among them, Gen Z are keenest to start running more, with 43% of 18-28-year-olds saying they want to start running or run more frequently in the upcoming 12 months. Much the same as last year, our data aligns with other published research which shows Gen Z care more about their wellbeing than previous generations, with a study by EY showing that over half of Gen Z rate their mental and physical health as the primary measure of future success.
ㅤ
Where In The UK Runs the Most?
Belfast leads the UK cities that run the most, with the proportion of runners 7% higher than the national average of 17%. London places second, with 22% of those in the capital running, and is the only city in the south to feature in the top 10.
ㅤ
Northern and Midlands cities Birmingham, Liverpool and Manchester also over-index when it comes to runners and Glasgow, with 18% of its inhabitants running, is the only Scottish city to make the list.
ㅤ
Top 10 Cities Who Run the Most
| RANK | CITY | % OF RUNNERS |
| 1. | Belfast | 24% |
| 2. | London | 22% |
| 3. | Birmingham | 20% |
| 4. | Liverpool | 20% |
| 5. | Manchester | 19% |
| 6. | Glasgow | 18% |
| 7. | Sheffield | 18% |
| 8. | Nottingham | 18% |
| 9. | Bristol | 17% |
| 10. | Leeds | 16% |
ㅤ
How Often Do People Run?ㅤ
The most common running frequency amongst runners is two to three times a week, with 36% of people telling us they run this often.
ㅤ
A smaller portion, 18% head out once a week, such as runners who tend to focus on a single, longer training run when preparing for a long distance race like a marathon. This aligns with the one in 10 runners who say they plan to enter a marathon in 2026 (read more about this later, in the competitive running section of our report).
ㅤ
Interestingly, Strava’s 2025 Year in Sport report found that runners who are training for a marathon and completed their long runs on Saturdays were more likely to stick to their training plans than those attempting long runs during the week.
ㅤ
For those running more frequently, the figures are lower but still impressive: 17% run between four and six times per week, while 9% run every day.
ㅤ

ㅤ
How Does Running Frequency Differ Between Genders and Generations?
It’s no surprise that running habits differ significantly by gender and age, revealing clear differences in how running fits into people’s lives. As in previous years, men are more likely to run outdoors than women overall, with 23% of men saying they run at least once a year, compared to nearly one in six (15%) women.
ㅤ
Age is an even stronger differentiator when it comes to running frequency. Millennials are the generation who run the most often, with just under a third (30%) running at least once a year. Gen Z are closely behind though, with 27% hitting the road or trails at least once annually. This drops by nearly half for Gen X, of whom 15% run at least once a year, while the figure more than halves again for baby boomers (5%). This steep drop showcases how much less likely older adults are to run regularly, which, as we’ll see in the barriers to running section, is often due to perceived age-related barriers rather than physical ability.
ㅤ
Later on in the report, we’ll explore how safety concerns, confidence and injury risk contribute to these differences – including how older runners are more likely not to run due to feeling too old, despite this age group experiencing more benefits from running and being less likely to injure themselves.
ㅤ
What Kind of Runs Are People Doing?
Although our key running figures just looked at those running on the road, trail, track and cross country, we did want to discover the range of different types of running the UK is taking part in – from jogs on the treadmill to running within exercise classes.
ㅤ
According to the data, the most common type of run is a casual or leisure run (31%), followed closely by treadmill running (30%), with road running accounting for just 21% of all runs. This suggests that for many of those who say they run at least once a week, running is a more relaxed and informal hobby, fitting around lives and work, rather than being a structured and regimented exercise routine or even training programme for competitive events. Participation in run clubs, like parkrun, is also up 2% this year, showing that there is still a growing interest in running being a social event too.
ㅤ

ㅤ
Treadmill running, in fact, is slightly more popular among women, who are nearly 5% more likely than men to use a treadmill for running. With women more likely to face intimidating behaviour when running in public, it’s perhaps no surprise that they’re more likely to turn to the treadmill – which more often than not is situated in a safe, gym environment. Later in the report, we explore these safety concerns further.
ㅤ
Beyond solo running, other types of running have seen growth too. Running in a group is up 2% year-on-year, now accounting for nearly 1 in 10 runs in the UK, while running with dogs has also become more popular (up 3%). In 2025, we partnered with veterinary surgeon Amanda from Dogs Trust to reveal which dog breeds are best suited for running, as well as tips on how to run safely with your dog. Head to the link above to read more about it, if you and your furry friend are hoping to hit the trails together this year.
ㅤ
What Motivates People to Run?
In Numbers:
• The most common reasons people run are to maintain or improve fitness (37%)
• Both men and women agree their top running priority is maintaining or improving fitness, but for men the second biggest motivation is to challenge themselves (32%) whereas for women it’s to lose weight (34%)
• 9% of runners say they are motivated to run to achieve a goal such as a marathon
• For Gen Z the top motivation is to look better, while for all other generations it’s to maintain or improve fitness
• The biggest running benefit people experience is improved mental health and mood (32%)
ㅤ
ㅤ
The top reason people run is to maintain or improve their fitness (37%). This is followed by the desire to challenge themselves and to lose weight (both 30%). Mental health is also a key motivator, with more than a quarter (28%) of runners saying that improving or maintaining their mental wellbeing is why they lace up their trainers.
ㅤ
Perhaps surprisingly, just 13% opt for running because it’s a low-cost way to get fit – despite its reputation for being an inexpensive way to exercise. We’ll explore this perception later in the report, when we look at how much the average runner is spending on the sport each year.
ㅤ
How does running motivation vary by age and gender? Well, for Gen Z the biggest motivator is improving appearance (29%), whereas for all other age groups it’s maintaining and improving fitness that dominates their motivation.
ㅤ
Likewise, while men and women agree that their top priority is to maintain or improve fitness, men are more likely to be motivated by the desire to challenge themselves (32%), whereas women are more likely to be driven by a weight loss goal (34%).
ㅤ
The Top 10 Motivations for Running
| RANK | MOTIVATION | % OF RUNNERS WHO AGREE |
| 1. | Maintain / improve fitness | 37% |
| 2. | To challenge myself | 30% |
| 3. | To lose weight | 30% |
| 4. | Maintain / improve mental wellbeing | 28% |
| 5. | To look better | 28% |
| 6. | Gets me in the outdoors | 22% |
| 7. | To have a hobby | 15% |
| 8. | It is low cost compared to gym memberships and team sports | 13% |
| 9. | To get fitter or faster than someone I know | 12% |
| 10. | To explore new places | 11% |
ㅤ
Identical to last year, just 9% of runners say a goal like a competitive event is what gets them out the door, even though over half (54%) say that they took part in a competitive event of some kind in 2025. As in previous years, when this is coupled with the people who are considering a competitive event, in 2026 (61%) it seems that although competition doesn’t drive people to start running, it often becomes a part of their continued motivation later down the line.
ㅤ
For anyone looking to include an official race event in their running journey this year, jump ahead to the section on the world’s most in-demand races if you want a heads up on the ones you’ll want to snap up a spot in as soon as possible.
ㅤ
What Are the Benefits of Running?
Although the main motivation among runners is to improve fitness, this doesn’t even crack the top five benefits runners say they most commonly experience. Improved mental health is the top reported benefit, with nearly a third of runners (32%) saying it’s one of the top advantages of their running.
ㅤ
The top three benefits remain unchanged year-on-year, with sleeping better (30%) and having more energy (30%) completing the top three after improved mental wellbeing. Looking at the results one thing is clear, for many runners the value of running itself extends far beyond physical fitness alone. Putting one foot in front of the other, whether on the treadmill, trail or pavement, supports both their mental and physical wellbeing.
ㅤ

ㅤ
For men, the biggest benefit running offers is better sleep (32%), while for women it’s improved mental health and mood (32%). In fact, women are more likely to cite stress relief and body confidence benefits, while men are more likely to cite better sleep and time away from devices – reinforcing just how personal our running journeys can be, varying in format and benefit from person to person, and among different ages and genders.
ㅤ
Perhaps interestingly, only one in 10 cite ‘making friends’ as a benefit, which suggests that running is more about personal wellbeing than socialising, for most. Considering the fact that year-on-year only around 1 in 10 say they run in a group, and that this year a huge 42% said they opt for solo runs, the data reinforces the idea that, despite group running being up year-on-year, running tends to still be a very individual experience.
ㅤ
We also delved into the benefits experienced by age group, and it’s particularly interesting to see the contrasts. While younger runners over-index on social motivations, older runners over-index on wellbeing and recovery. Over 55s are nearly twice as likely as those aged 18-24 to say running helps them feel less stressed (35% vs. 20%), and they’re also nearly twice as likely to say running has improved their fitness (30% vs. 17%).
ㅤ
Since people over 55 are more likely to not run because they think they’re too old, it’s important that we look at how we can make running accessible to people of all ages. If you’re over 50 and wanting to make a change to your fitness - jump ahead to the next section where we discuss blockers to running, to get tips on how you can protect yourself if you’re worried about bone health or injury risks.
ㅤ
The Top 10 Benefits Runners Experience
| RANK | BENEFIT | % WHO AGREE |
| 1. | Improved mental health / mood | 32% |
| 2. | I sleep better | 30% |
| 3. | I have more energy | 30% |
| 4. | I feel less stressed | 27% |
| 5. | I feel stronger | 27% |
| 6. | Improved fitness (such as feeling less breathless when climbing the stairs) | 24% |
| 7. | Time to be by myself | 22% |
| 8. | I have more body confidence | 22% |
| 9. | Time away from devices | 17% |
| 10. | Time to listen to music or podcasts | 15% |
ㅤ
What Prevents People from Running?
In Numbers:
• 81% of the UK population don’t run
• The primary reason people don’t run is that they don’t enjoy it (27%)
• A quarter of people feel too old to run, while just over one in five think they’re too unfit to run (22%)
• One in 10 people in the UK think they’re too overweight to run
ㅤ
ㅤ
According to this year’s data, a huge 81% say they don’t run outdoors, despite consistently growing interest in the sport and significant numbers of people telling us each year they want to run more.
ㅤ

ㅤ
This figure does tally however, with YouGov data where 41% of the UK population admit that ‘I’ve learned to accept that healthy eating and running just aren’t for me’1.
ㅤㅤ
Age remains the strongest predictor of whether someone is likely to run or not. The proportion of non-runners is roughly the same for Millennials to Gen X (70% and 73%) and a large 95% of boomers don’t run at all.
ㅤ
Though the top reason for not running is a lack of enjoyment (the same as in previous years) this is slightly different for men and women. For men, the most common reason is feeling too old (29%) whereas women are more likely to cite a lack of enjoyment (28%).
ㅤ
Other common barriers for both genders include health conditions or injuries (25%), feeling too unfit (22%) and finding the sport boring (16%). Notably, the number of people who find it painful has risen by 4% over the last twelve months.
ㅤ
With so many people each year saying they want to run more, but the actual proportion of runners among the population staying the same each year - it’s clear there are some serious blockers to the sport.
ㅤ
Top 10 Reasons Why People Don’t Run
| RANK | REASON FOR NOT RUNNING | % WHO AGREE | % CHANGE YOY |
| 1. | I don't enjoy it | 27% | No change |
| 2. | I feel too old | 25% | +2% |
| 3. | I have a health condition or injury that means I can’t | 25% | +1% |
| 4. | I think I am too unfit | 22% | +2% |
| 5. | I find it painful | 20% | +4% |
| 6. | I find running boring | 16% | +1% |
| 7. | I am not very good at it | 13% | +1% |
| 8. | I’m scared of falling over / getting an injury | 11% | +3% |
| 9. | I think I am too overweight to run | 10% | +2% |
| 10. | I feel embarrassed when other people see me running | 9% | No change |
ㅤ
What Challenges Do Runners Face?
It’s not just non-runners who face blockers to participation. Even among regular runners, maintaining consistency can be challenging, and despite running seemingly being one of the most accessible forms of fitness, it is still subject to many of the same obstacles that affect participation in any physical activity across the board.
ㅤ
The biggest challenge of all? A lack of motivation, which nearly a quarter of runners (24%) agree they experience. Women are more likely to experience this than men (26% vs. 23%). Those aged 25-34 are least likely to feel unmotivated, which reflects their higher levels of participation in the sport.
ㅤ
The top three most common challenges faced by runners include managing breathing, and the fact that the weather in the UK isn’t always good for running (both 20%).
ㅤ
Running coach Gary House offers some perspective for runners that find breathing a challenge:
“The honest answer is that running isn’t easy and sometimes managing your breathing is almost impossible. It's not always a bad thing to be breathing hard, it shows you are working hard. This is especially the case when runners first start out and although the answer most people give is ‘just slow down’, that's no use to someone who is already running as slow as they can.
If slowing down is an option then great, take some walk breaks or do basic intervals so you have rest periods. Otherwise, you can work on your breathing by working your core more with things like Pilates or specific breathing classes. Ultimately though, I'm never worried if someone’s breathing rate is high – it's only one indicator of many for effort and the more you do run the more you can manage it.”
ㅤ
One in 10 runners say persistent injuries are their biggest challenge, if this applies to you - jump ahead to our running training, gear and injuries sections to read more about the injuries runners are most likely to face, as well as guidance on training, footwear and recovery to help reduce the risk of injury.
ㅤ
Top 10 Biggest Challenges Runners Face
| RANK | CHALLENGE | % OF RUNNERS WHO AGREE |
| 1. | Lack of motivation | 24% |
| 2. | Managing my breathing | 20% |
| 3. | The weather isn’t good for running (it’s too hot, cold, snowy, wet etc) | 20% |
| 4. | Getting fatigued quickly | 19% |
| 5. | I can’t find enough time to do it | 16% |
| 6. | It’s dark when I want to run | 14% |
| 7. | Eating the right food | 14% |
| 8. | Finding safe or convenient places to run | 13% |
| 9. | Sleeping well | 13% |
| 10. | Worries about safety | 12% |
ㅤ
Running Safety
In Numbers:
• 65% of runners have felt unsafe while running, a significant 23% increase year-on-year
• Women feel unsafe more often than men (72% vs 60%), though reported unease has increased for both genders
• Gen Z runners report the highest levels of unease, with over 4 in 5 (83%) having felt unsafe while running
• Intimidation while running is also unfortunately common, affecting 62% of runners
• Women are more likely to experience intimidation (67%) than men (58%), particularly catcalling which disproportionately affects female runners
ㅤ
ㅤ
Concerns around personal safety while running continue to rise, with almost two thirds (65%) reporting that they have felt unsafe while out running. This represents a huge 23% point increase year-on-year, indicating that safety anxiety is becoming an increasingly common part of the running experience.
ㅤ
Feelings of unease are significantly more pronounced at night, with 57% of runners saying they feel unsafe when running after dark compared to 44% in daylight.
ㅤ
The lack of feeling safe when running also varies by location, with runners in several UK cities reporting higher levels of unease than others. Sheffield records the highest proportion of runners who say they feel unsafe while running (76%), followed by Birmingham (75%) and Nottingham (70%). London, Manchester, Belfast and Liverpool also sit above the national average for feelings of running safety.
ㅤ
Cities where runners feel the most unsafe:
1. Sheffield - 76%
2. Birmingham - 75%
3. Nottingham - 70%
4. London – 70%
5. Manchester - 67%
6. Belfast - 67%
7. Liverpool - 67%
8. Bristol - 65%
9. Southampton - 63%
10. Newcastle - 61%
ㅤ
This lack of feeling safe when running may be closely linked to runners’ experiences whilst out on their routes. Almost two thirds of runners (62%) say they have experienced some form of intimidating behaviour while running, with the most commonly reported intimidating experiences being ‘feeling like someone is staring at you’ (21%), ‘being beeped at from a car’ (19%), and ‘feeling like someone is following you’ (18%).
ㅤ
Women continue to report higher levels of safety concern while running than men. Nearly three quarters of female runners (72%) say they have felt unsafe while running, a figure that has increased by 24 percentage points year-on-year, indicating that feelings of unease are becoming more widespread among women. Worries about safety are also holding back women who don’t run, 9% of women say they don’t run in public because they are concerned about their safety.
ㅤ
These concerns are reflected in reported experiences, with 67% of women saying they have encountered some form of intimidating behaviour while running. Female runners are particularly likely to report experiences such as feeling stared at, followed, or catcalled. Catcalling has the largest disparity between genders; women are more than twice as likely to experience it.
ㅤ
Intimidating Experiences Faced by Runners
ㅤ

ㅤ
Generational differences in running safety are clear, with younger runners reporting significantly higher levels of unease and intimidation than older age groups. Over 4 in 5 (83%) of Gen Z runners say they have felt unsafe while running, the highest of any generation. This is reflected in their experiences, with 80% of Gen Z reporting that they have encountered intimidating behaviour while running.
ㅤ
Levels of intimidation whilst running decline steadily with age, affecting 68% of millennials, 45% of Gen X, and 37% of baby boomers.
ㅤ
In response to ongoing safety concerns, many runners report adapting their behaviour to feel more secure while running. The most common precaution is telling someone before heading out for a run (60%), followed by avoiding revealing clothing (58%) and sticking to well-lit streets (56%). More than half of runners also report wearing a fitness or running tracker (53%) or restricting their runs to daytime hours (51%).
ㅤ
Additional measures include running in busy areas (37%), running without headphones (37%), and avoiding trail running due to a lack of other people around (34%). Across nearly all precautions, women are more likely than men to change their behaviour, highlighting a clear gender difference in how runners adapt their routines in response to safety concerns. Further advice on running safety has been shared by Women’s Running.
ㅤ
Lauren Green, runner and founder of Empowered Women Fitness, has experienced being followed, shouted at and cat called whilst running. She now makes a number of adjustments to her runs to try and feel safer: “I avoid running in the dark, but even when the light dims I use Strava heat maps to ensure where I’m running is frequently used, I wear body lights, tell loved ones I’m going on a run, bring a whistle and I only wear bone-conducting headphones or no headphones at all so I can stay aware of my surroundings. When training throughout the winter as a busy working mum, it feels as though I only have a few hours to get my runs done as there is less daylight, this adds pressure and makes running feel less enjoyable.”
ㅤ
Lauren, who has become a running influencer with over 100,000 followers, has also created an early morning run club for women to provide a safer opportunity to train and also talks about running safety regularly on her platforms: “This is a topic that shouldn’t be brushed under the carpet, from the stories my friends have told, things I’ve read and from my own experiences, I know this is a real issue and needs to be spoken about. I choose to speak up so that others feel comfortable to, I know how important awareness is.”
ㅤ
Most Common Safety Precautions Runners Are Taking
| RANK | SAFETY PRECAUTION | ALL RUNNERS | DIFFERENCE BETWEEN WOMEN AND MEN |
| 1. | I make sure to tell someone that I'm going running | 60% | +14% |
| 2. | I don’t wear anything too revealing | 58% | +14% |
| 3. | I only run on well-lit streets | 56% | +15% |
| 4. | I wear a running/fitness tracker (like Apple Watch or Garmin) | 53% | +6% |
| 5. | I only run during daytime | 51% | +14% |
| 6. | I only run in busy places | 37% | +14% |
| 7. | I run without headphones | 37% | -1% |
| 8. | I don’t do trail running as there is normally no one else around | 34% | +6% |
| 9. | I run with keys within my fingers | 28% | +5% |
| 10. | I carry a personal alarm with me (such as a rape alarm) | 28% | +8% |
ㅤ
Running Training, Kit and Technology
In Numbers:
• The most common way runners plan their runs is simply seeing how they feel on the day with 38% of runners following this process
• However, a growing amount (12%) are using AI tools, such as ChatGPT, to plan their runs and training
• 81% of runners use some form of running tech
• A quarter of runners (25%) have had a gait analysis, which is a notable increase compared with last year (+18%)
• Over half of runners (56%) do not replace their shoes at the recommended interval
• Runners spend an average of £1,296.54 a year on the sport, with men spending £348.23 more than women
ㅤ

ㅤ
How Are Runners Planning Their Runs?
The planning process tends to be fairly relaxed for most runners. With the most common approach simply seeing how they feel on the day, some 30% of runners say they just run as far as they can. For many, embracing this flexibility could make it easier to fit running around busy schedules and changing energy levels.
ㅤ
Apps also play a role for a sizeable group of runners. One in five (21%) use platforms such as Strava or Garmin to plan their runs, using data and past activity to guide distance, pace or effort.
ㅤ
A smaller but growing number are starting to use AI to help shape their training, with 12% turning to tools like ChatGPT or other AI based platforms. This is much more common among younger runners, with Gen Z and millennials around two and a half times more likely to use AI for run planning than Gen X.ㅤ
ㅤ
Gary warns that how you use AI is important to bear in mind: “While the use of AI might be on the rise, its effectiveness will always come down to the user. A runner would need to very honest with themselves (and their AI), give as much feedback and information as they can and remember that they still have to get out there and do the hard work themselves.”
ㅤ
At the other end of the spectrum, 1 in 10 (11%) say they do not plan their runs or training at all, instead keeping things completely informal.
ㅤ
If you’re tempted to try planning out your runs in 2026, SportsShoes app users can get a month’s free trial of Run Coaching app Coopah, and you can join the SportsShoes Strava Club to access exclusive discounts and prizes.
ㅤ
The Top 5 Ways People Plan Their Runs
| RANK | HOW RUNNERS PLAN THEIR RUNS | % WHO DO THIS |
| 1. | I just see how I feel on the day | 38% |
| 2. | I just run as far as I can | 30% |
| 3. | I use a running or tracking app (like Strava or Garmin) | 21% |
| 4. | I find tips and advice on social media (Reddit, Instagram, TikTok) | 14% |
| 5. | I use ChatGPT or other AI Large Language Model (like Gemini or Perplexity) | 12% |
ㅤ
What Are Runners Training For?
For many runners, having an event on the calendar is a key source of motivation, helping to shape how and why they train. In 2025, over half of runners (54%) took part in some form of competitive running, with participation highest among younger age groups. Almost seven in 10 Gen Z runners (69%) competed in 2025, compared with 60% of millennials, 40% of Gen X, and 25% of baby boomers.
ㅤ
Nearly half of runners (48%) say they are currently training for a competitive event, and interest remains high for the year ahead. Six in ten runners (61%) are considering taking part in a competitive run in 2026, rising to over three- quarters of Gen Z runners (76%).
ㅤ
When it comes to the types of events runners choose, shorter distance races tend to be the most accessible starting point. Across events runners have taken part in, are currently training for, or are considering for the future, 5k races and fun runs are the most commonly mentioned. Longer distance races such as marathons appear more often as future ambitions, suggesting many runners see them as longer-term training goals. This is supported by the fact that many marathons are seeing surging numbers of applications, the London Marathon saw a 36% increase in applications for 2026.
ㅤ
The Competitive Events Runners Are Currently Training For
| RANK | RUNNING EVENT | % OF RUNNERS CURRENTLY TRAINING FOR THIS EVENT |
| 1. | 5k | 12% |
| 2. | Fun run | 12% |
| 3. | 10k | 9% |
| 4. | Half-marathon | 8% |
| 5. | Marathon | 7% |
| 6. | CrossFit | 6% |
| 7. | Tough Mudder | 4% |
| 8. | Spartan Race | 4% |
| 9. | Triathlon | 4% |
| 10. | Ultramarathon | 4% |
ㅤ
What Technology Are Runners Using?
Technology is now part of the everyday running routine, with 81% of runners using it to help runners track progress, stay motivated and make sense of their training. From music and podcasts to GPS tracking and apps, digital tools have become a familiar part of getting out the door or onto the treadmill.
ㅤ
The most used pieces of running technology focus on tracking and audio. Wireless headphones are used by 41% of runners, closely followed by smartwatches at 40%. Nearly a quarter of runners (23%) use running apps, reinforcing the role of digital tools in planning, tracking, and reviewing runs.
ㅤ
Technology use varies by age. Gen Z are the most likely to use running tech, with 90% using at least one form of technology, followed by millennials at 87% and Gen X at 72%.
ㅤ
High performance footwear also attracts plenty of attention but remains a more niche choice. Carbon plated running shoes are worn by 7% of runners and are most often used for races or specific performance focused goals, rather than everyday training.
ㅤ
The Most Commonly Used Running Technology
1. Wireless headphones – 41%
2. Smartwatch – 40%
3. Running apps – 23%
4. Wired headphones – 16%
5. Heart rate monitor – 10%
ㅤ
What Is the Cost of Running?
Running is often seen as a simple, low-cost sport to get into, but spending patterns show that many runners make a significant financial commitment to their training. While a single run may require little more than a pair of shoes, over the course of a year, small costs can quickly add up.
ㅤ
On average, runners spend £1,296.54 per year on the sport and there is a clear difference in spending by gender. Men spend an average of £1,458.93 per year which is £348.23 more than women, who spend £1,110.70.
ㅤ
Footwear represents the largest single area of spend. Runners spend an average of £186.64 per year on shoes, reflecting the need to replace footwear regularly due to wear, particularly for those running higher mileage or rotating multiple pairs. Gym memberships (£164.00) and technology (£154.89) follow closely behind.
ㅤ
Costs extend beyond core kit, with areas such as clothing, supplements, coaching and race entry fees all contributing to annual spend. Events in particular can increase costs through entry fees, travel, and event day kit.
ㅤ
Average Annual Spend Per Category
| RANK | ITEM | ALL RUNNERS |
| 1. | Shoes | £186.64 |
| 2. | Gym | £164.00 |
| 3. | Tech | £154.89 |
| 4. | Other kit | £139.98 |
| 5. | Supplements | £130.85 |
| 6. | Coach/PT | £115.20 |
| 7. | Apps | £103.45 |
| 8. | Magazines/books | £102.53 |
| 9. | Race fees | £100.46 |
ㅤ
Are Runners Running in the Right Shoes?
Choosing the right running shoes is one of the most important parts of running, but it is also one of the areas runners find most confusing.
ㅤ
Nearly two- thirds of runners (62%) say they do not know their running style, such as whether they are neutral, overpronate or underpronate. While awareness has improved compared with last year, when 90% of runners did not know their running style, many runners are still making footwear decisions without clear guidance.
ㅤ
Even so, most runners are actively trying to make the right choice. Over half (52%) say they have bought shoes for what they think is their running style, suggesting good intentions even when information is limited. This uncertainty shows up in confidence levels, with more than a third of runners (37%) saying they are not confident they are wearing the right type of shoes for how they run.
ㅤ
One area where awareness is clearly improving is gait analysis. A quarter of runners (25%) have now had their gait analysed, a significant increase compared with last year when fewer than 7% had done so. Uptake is highest among younger runners, with a third of 25 to 34-year-olds having had a gait analysis, compared with just 13% of runners aged 55 and over.
ㅤ
How Often Do Runners Change Their Shoes?
Alongside understanding running style, how runners use and replace their shoes also plays a big role in comfort and injury risk.
ㅤ
Our data shows many runners are still holding on to their shoes for longer than recommended, often without realising the impact this can have. More than half of runners (56%) say they do not replace footwear every 500 to 750 kilometres, meaning shoes may be worn beyond the point where cushioning and support start to break down. To put that into perspective, running two 5ks a week would equate to 520 kilometres annually.
ㅤ
Almost half of runners (48%) say they wear their running shoes for everyday activities such as errands, which can speed up midsole compression and reduce a shoe’s ability to absorb impact during runs.
ㅤ
There has also been a noticeable increase in the number of runners still using their original pair of running shoes, with over a third of runners (37%) still wearing the shoes they started running in. While this may reflect more people taking up running, as training builds and mileage increases, that first pair may no longer offer the cushioning or support runners need to stay comfortable and confident.
ㅤ
Gary comments: “With lots of shoe choice now available it is important for runners to use the right tool for the job – this means knowing the terrain, distance and intensity you plan to run so that you can match a shoe choice. Changing your shoes when the foam or uppers have lost integrity can mean that you can continue to run and train with confidence that you can recover to the best of your ability.”
ㅤ
Running Injuries and Complementary Training
In Numbers:
• Three-quarters of runners (75%) have sustained a running injury, up from 70% last year
• A quarter of runners (25%) have had to defer a race place due to injury
• Nine out of 10 runners do some form of complementary training, with walking the most common additional activity (55%), followed by swimming (28%) and cycling (22%)
• Strength training is more commonly adopted in response to injury rather than as a preventative measure
ㅤ

ㅤ
Running brings huge physical and mental health benefits, but for many runners, injuries are simply part of the journey. Three- quarters of runners (75%) say they have sustained at least one injury from running, an increase of 5% year-on-year. Men are slightly more likely to report injuries than women (78% vs 72%), but injuries can affect runners of all backgrounds and experience levels.
ㅤ
For many, the impact of injury goes beyond short term discomfort. Over a third of runners (34%) have sought professional support or treatment, and a quarter (25%) have had to defer a running event due to injury. These experiences highlight how injuries can interrupt training plans, delay goals, and force runners to adjust how they approach their running.
ㅤ
The Most Common Running Injuries
The most common injuries runners report are lower back pain and blisters, both experienced by 15% of runners.
ㅤ
‘Runner’s knee’ and ankle sprains follow closely behind at 13%, with runner’s knee showing the largest increase year-on-year (+3%).
ㅤ
The 10 Most Common Running Injuries
| RANK | INJURY | % OF RUNNERS WHO HAVE HAD THE INJURY IN 2026 | CHANGE FROM 2025 |
| 1. | Lower back pain | 15% | +2% |
| 2. | Blisters | 15% | +1% |
| 3. | Ankle sprain | 13% | +1% |
| 4. | Runner’s knee | 13% | +3% |
| 5. | Side stitches | 11% | No change |
| 6. | Hip/hip flexor pain | 9% | +2% |
| 7. | Shin splints | 9% | No change |
| 8. | Hamstring strains | 8% | No change |
| 9. | Plantar fasciitis | 7% | +1% |
| 10. | Pulled groin | 6% | +1% |
ㅤ
How Do Injuries Differ by Age?
The types of injuries runners experience tend to change over time. Younger runners are more likely to report metabolic and heat related issues. Dehydration peaks among 25 to 34-year-olds at 19%, compared with just 6% of runners aged 55 and over, with heat exhaustion and sunburn showing similar patterns.
ㅤ
Older runners, by contrast, are more likely to experience friction and impact injuries. Blisters are experienced by 19% of runners aged 55 and over, compared with 13% of those aged 18 to 24. Injuries such as lower back pain, runner’s knee, and hamstring strains also become more common with age, reflecting the growing importance of managing stiffness, load, and recovery as training continues over time.
ㅤ
The likelihood of avoiding injury actually increases with age, with just one in five (20%) runners aged 18 to 24 reporting never having a running injury, compared with 31% of those aged 45 to 54, and 33% of runners aged 55 and over. This may reflect greater experience, confidence in pacing, recovery, and listening to the body over time. If you’re looking for advice on how to avoid injury then our advice section has a range of articles that cover the subject.
ㅤ
How Are Runners Training Outside of Running?
For most runners, training is about more than just getting the miles in. Our data reflects this, with 9 out of 10 runners saying they do some form of complementary training.
ㅤ
Activities outside of running can help runners stay active, aid recovery, and give the body a break from the repeated impact that comes with regular mileage. Going for a walk as a form of exercise is the most common choice, with 55% of runners doing it at least twice a month. Swimming (28%) and cycling (22%) are also popular, offering low impact ways to maintain fitness while being kinder on joints and muscles.
ㅤ
Gary also stresses the importance of including other forms of activity in your training: “If the goal as a runner is to perform to the best of your ability, then maximising your running is key. The problem is as runners we usually enjoy running so much that we only focus on that.
I would run all day every day if my body would let me, but over the years I have learned that if I do a bit more cycling and a bit more strength work in the gym alongside a few periods of the year I don’t run as much, I can perform better.”
ㅤ
Millennials are the most likely to mix running with other activities such as swimming, yoga, gym based strength training and recovery practices. Younger runners also tend to be more open to emerging recovery trends, with cold plunges being taken up by 8% of Gen Z and millennials, compared with much lower uptake among older age groups.
ㅤ
Strength training features in many runners’ routines, with 21% strength training at the gym at least twice a month.
ㅤ
While strength work is often recommended to support running, our data suggests many runners turn to it as a response to injury, rather than as part of a long term-training approach. Just 18% of runners who strength train say they are injury free, compared with 27% of runners who do not.
ㅤ
The Top 10 Ways Runners Train (Outside of Running)
| RANK | PRACTICE | % WHO DO IT AT LEAST TWICE A MONTH |
| 1. | Walking | 55% |
| 2. | Swimming | 28% |
| 3. | Cycling | 22% |
| 4. | Strength training (at the gym) | 21% |
| 5. | Yoga | 17% |
| 6. | Massage | 16% |
| 7. | Team sports (rugby, football, hockey) | 13% |
| 8. | Sauna | 9% |
| 9. | Pilates | 9% |
| 10. | CrossFit | 8% |
ㅤ
The Top Running Shoes of 2025
Running shoes play a major role in runners' training and race-day experiences, helping to improve both comfort and performance across a variety of runs. With footwear technology continuously evolving, runners are looking for shoes that suit their personal goals, whether that’s chasing a personal best, building weekly mileage or prioritising comfort.
ㅤ
That’s why we’ve compiled a list of our top running shoe picks for the year. This isn’t a bestsellers list, but a carefully curated roundup of standout shoes that reflect the trends and innovations that shaped running footwear in 2025.
ㅤ
From carbon-plated race shoes to cushioned trainers for the everyday, these are the models that truly made an impact over the past year.
ㅤ
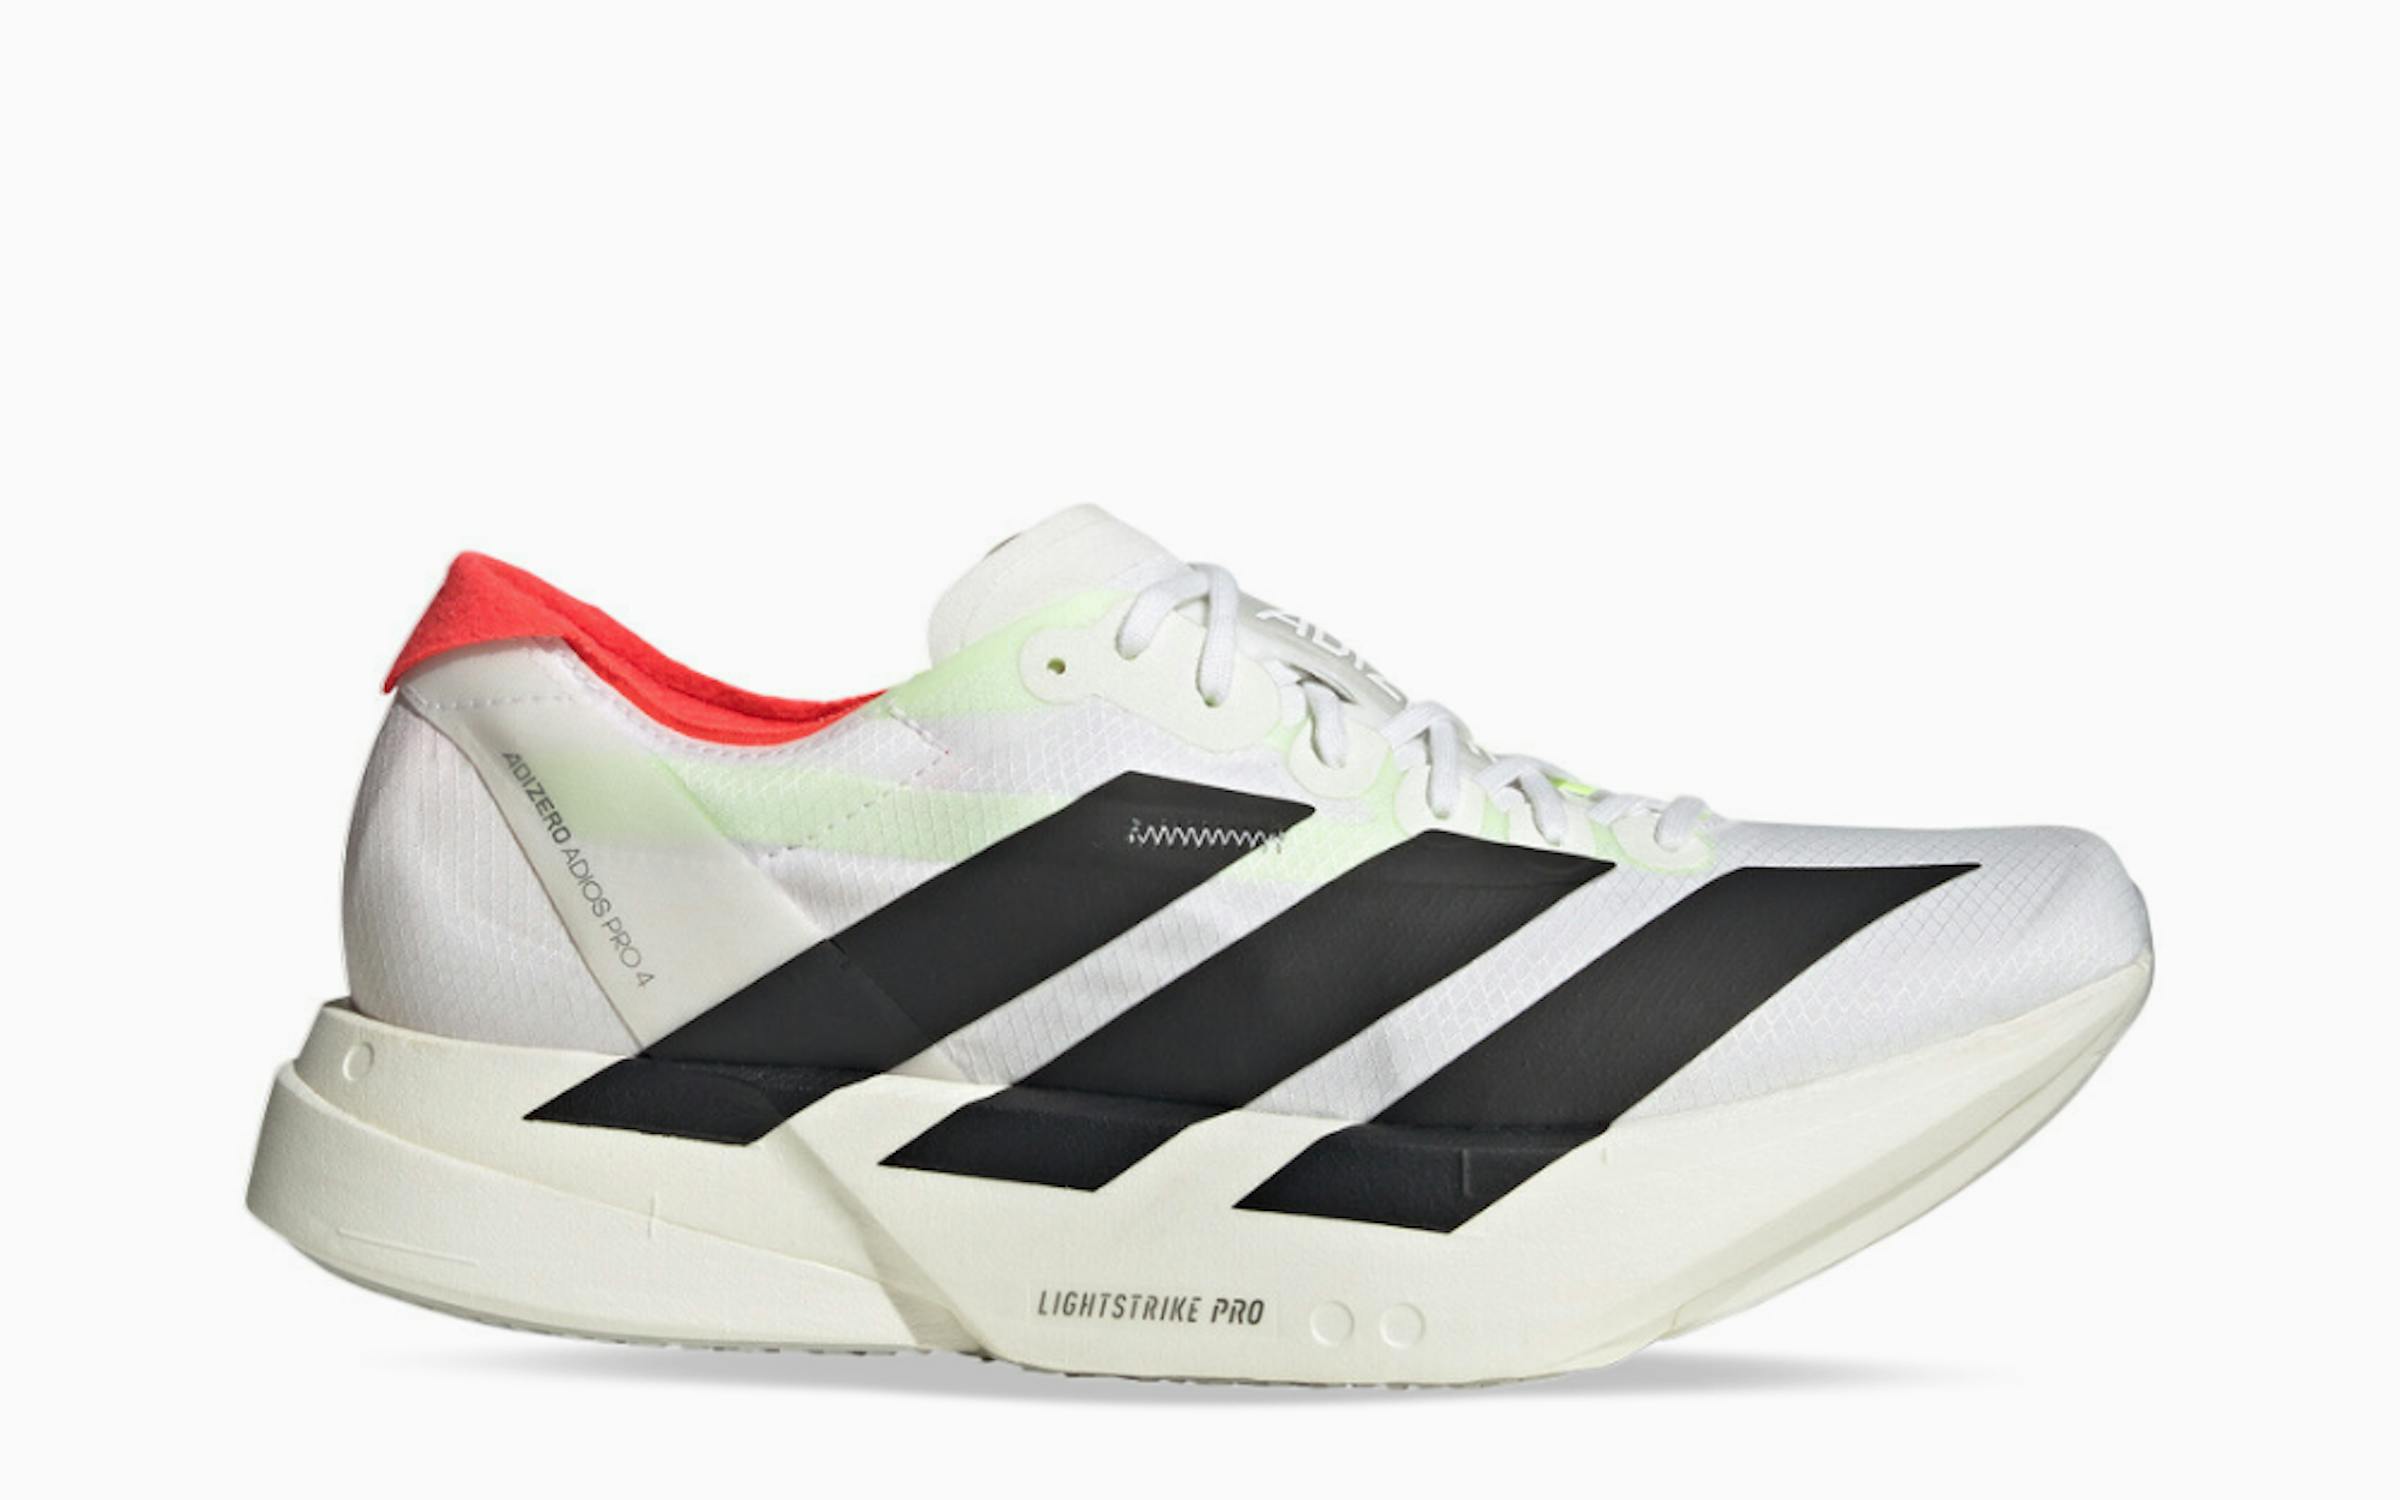
adidas: Adizero Adios Pro 4
The Adios Pro 4 is one of the defining carbon-plated marathon racers of 2025. It features two layers of Lightstrike Pro foam and carbon-fibre infused ENERGYRODS 2.0, it has become a fan favourite with both elites and everyday runners chasing a PB. Bright, high energy colour drops have helped this shoe stand out from start lines right through to the finish, where its legacy has been cemented with a women’s marathon world record of 2:11, set by adidas athlete Tigst Assefa. This shoe is certainly a race-day essential.
ㅤ
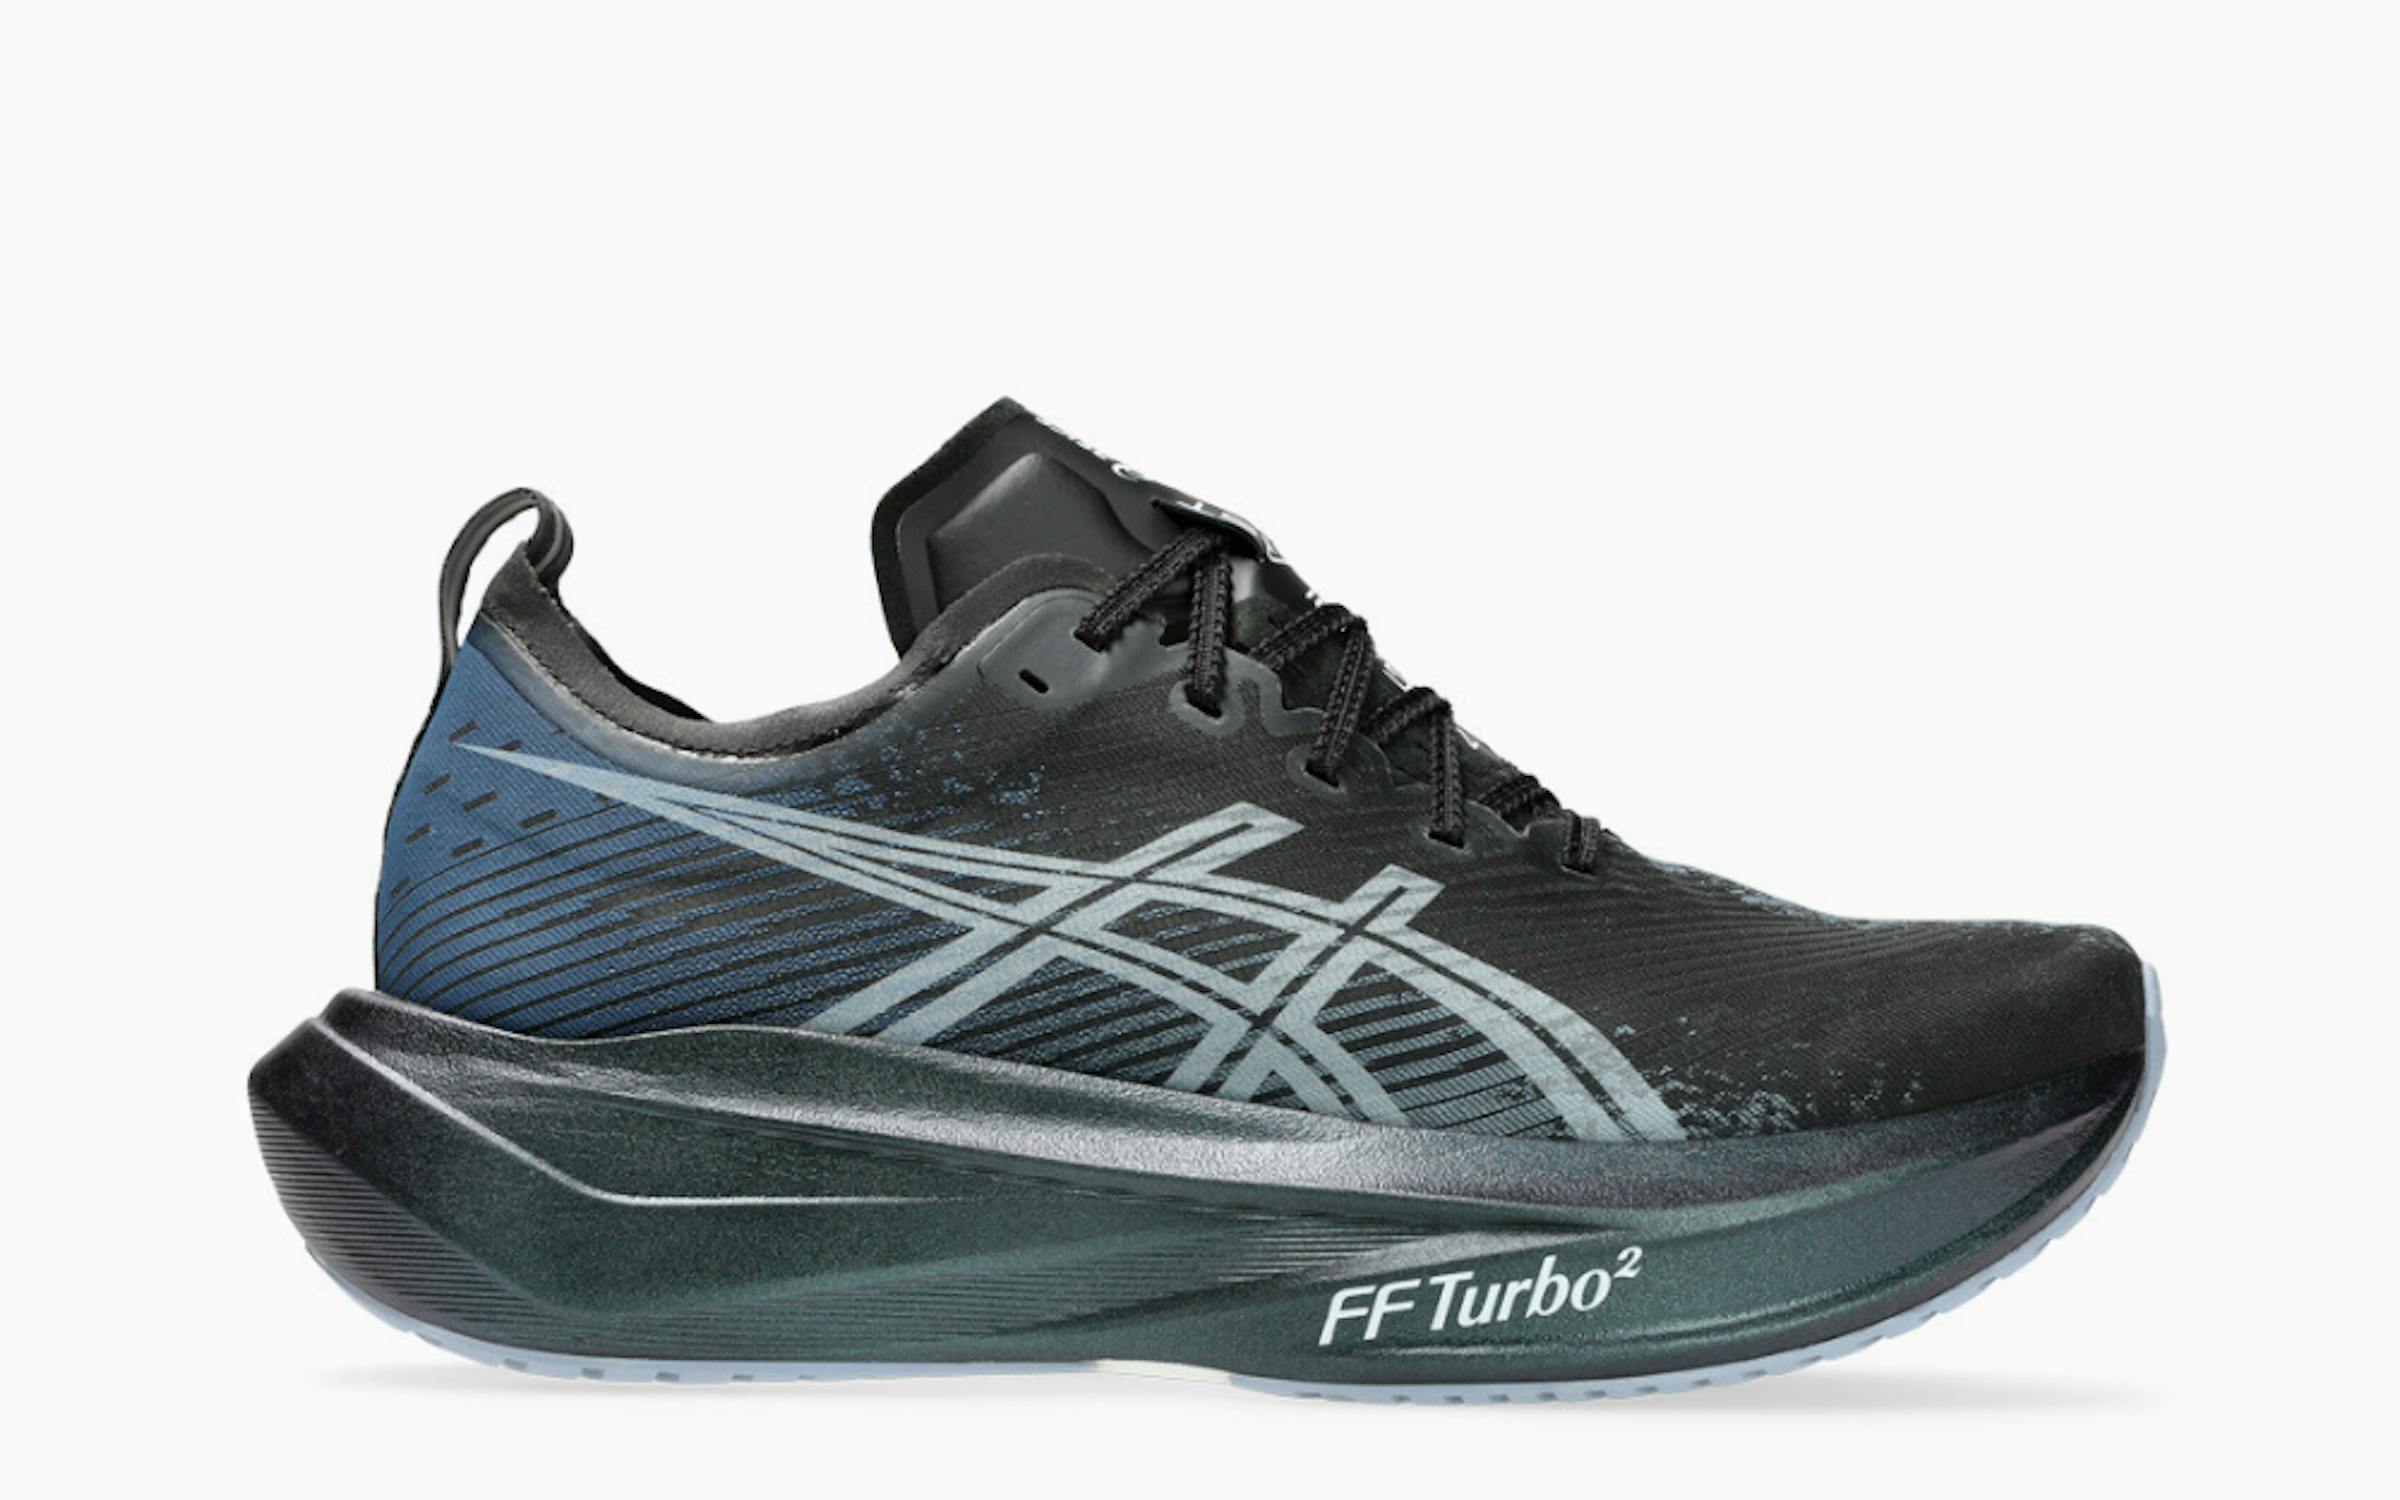
ASICS: Megablast
The Megablast is ASICS’ brand-new, energy-packed daily trainer for 2025 and a fresh addition to the Blast series that sits right in the sweet spot between plush cushioning and lively responsiveness. Its breathable engineered mesh upper adds comfort, making this a daily trainer that’s both lively and dependable. At the core of the shoe is ASICS’ new FF Turbo² foam, a lightweight and ultra-bouncy compound that delivers a surprising pop underfoot, while still feeling supportive across long miles.
ㅤ
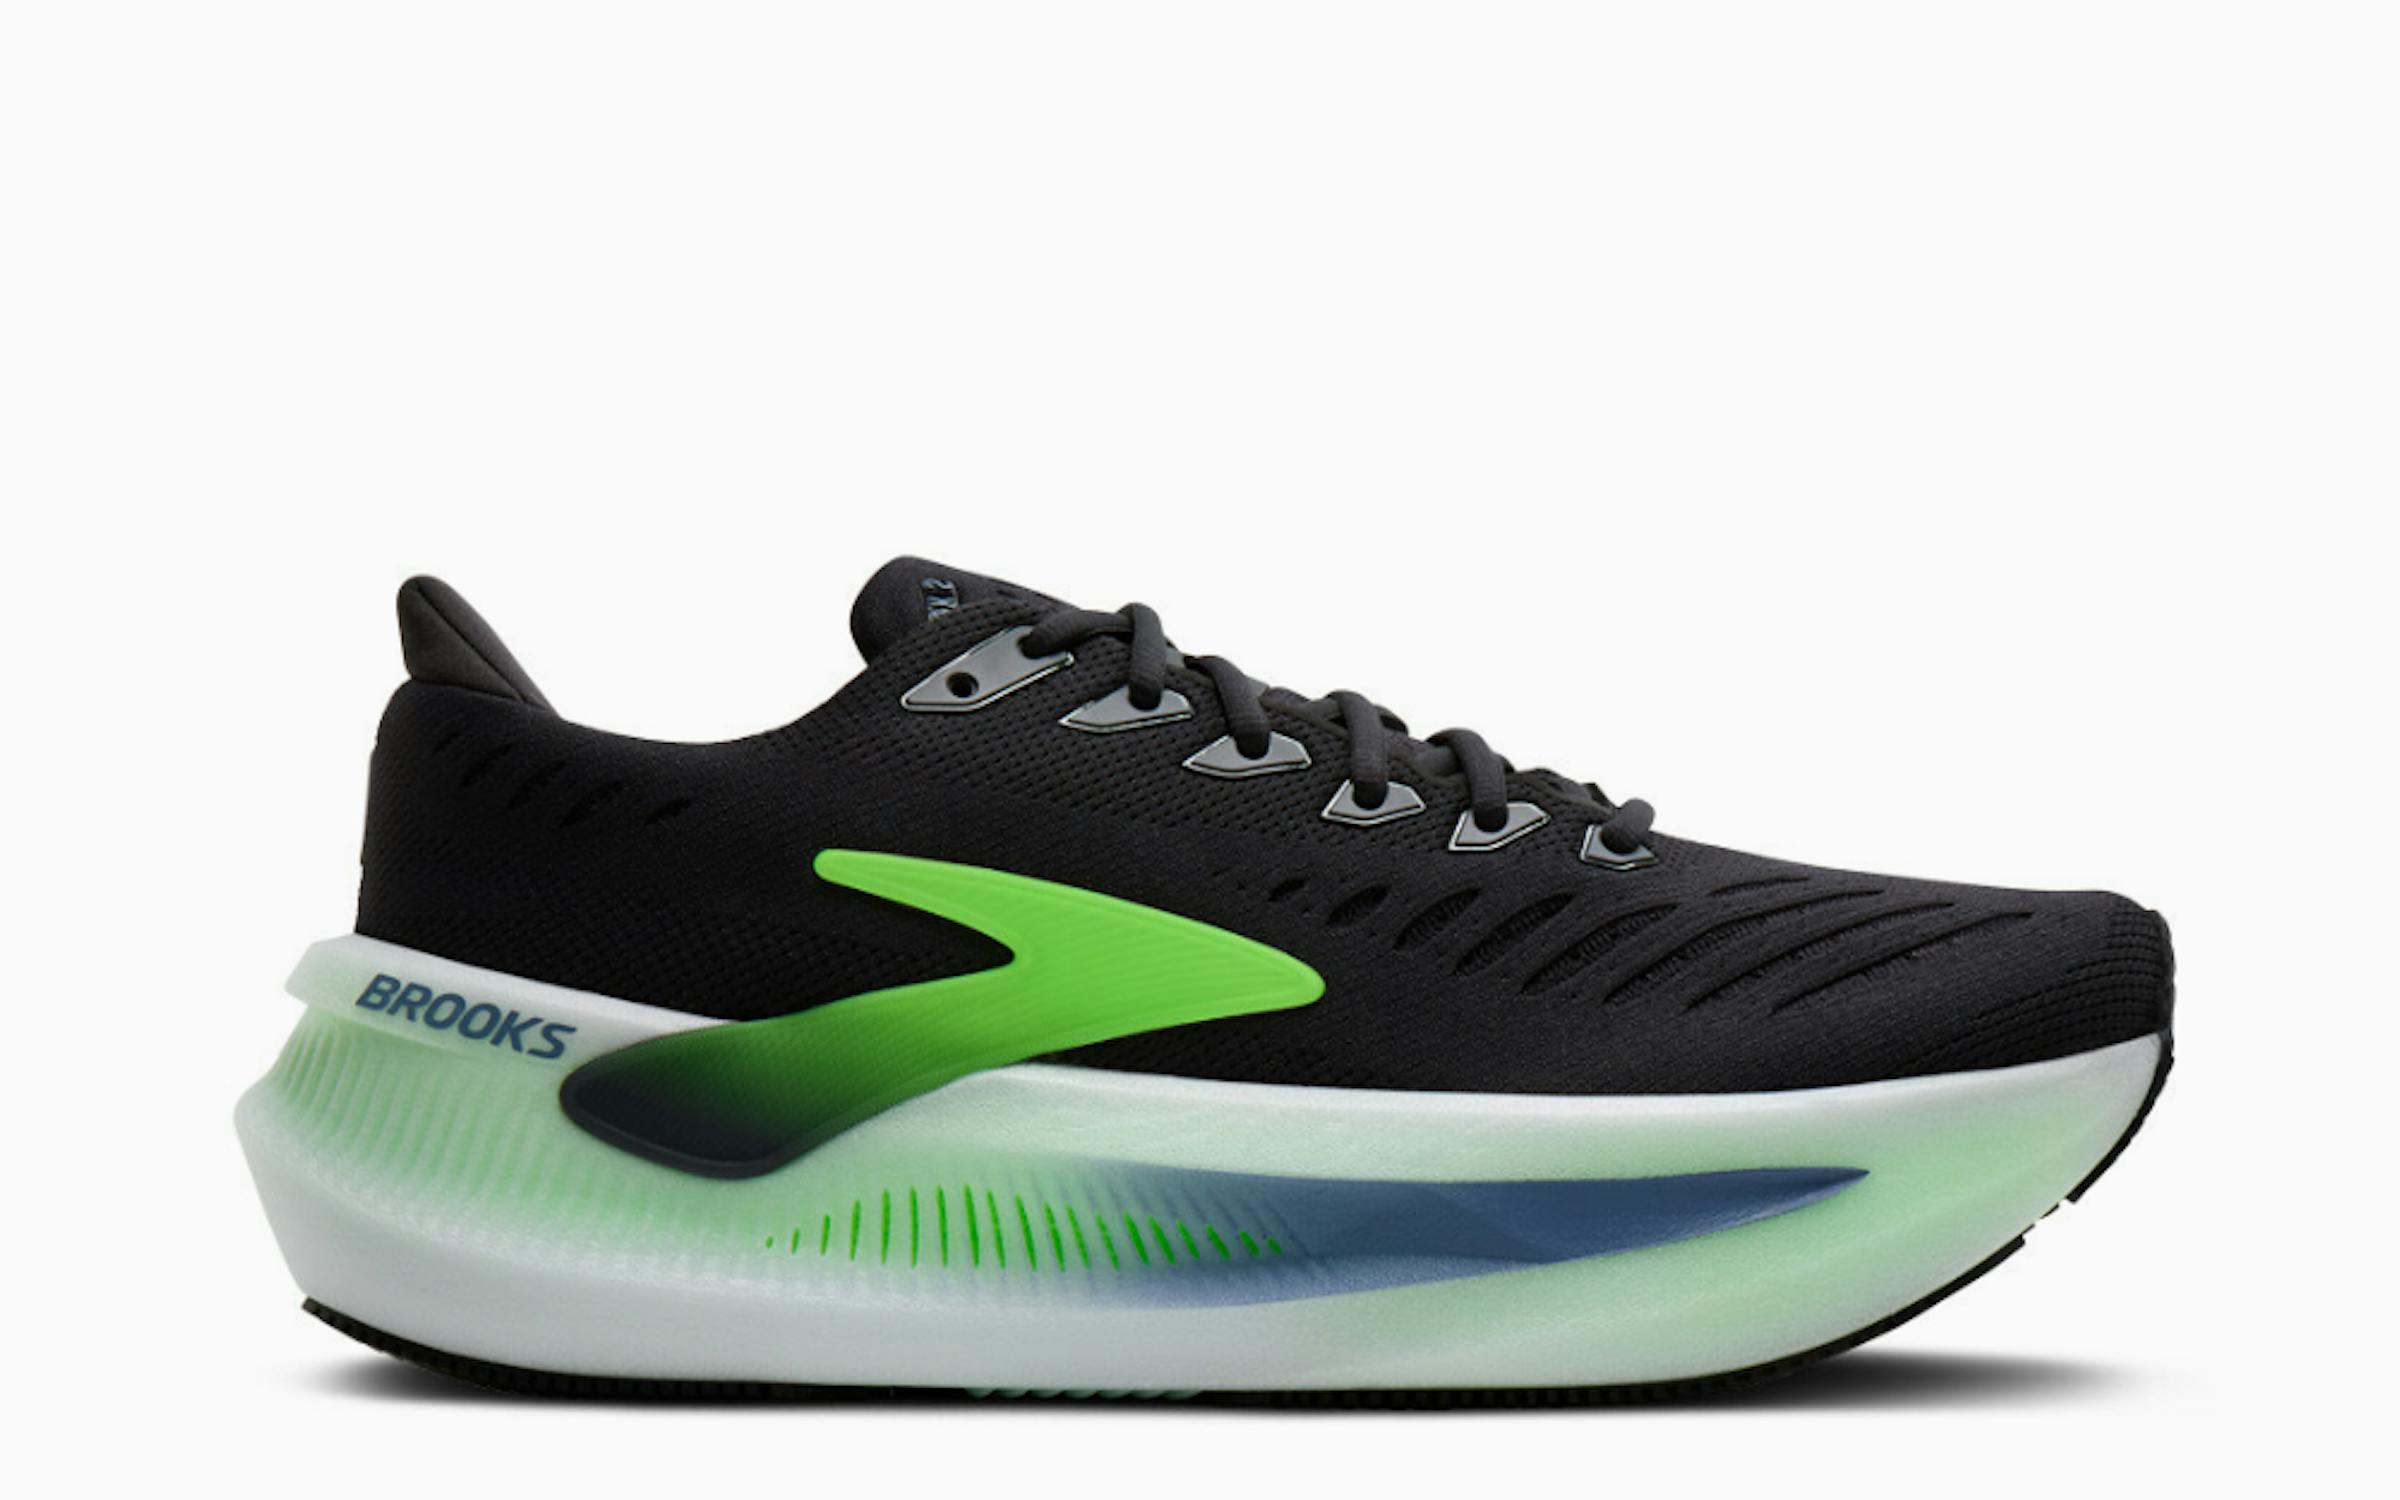
Brooks: Glycerin Max 2
Brooks continues to lead the comfort-first category, and the Glycerin Max 2 is their most cushioned model to date. With a towering stack of DNA Loft v4 Max foam, the shoe offers an ultra-soft platform that shines in long, steady miles or recovery days. In a year when more foam became a trend across the industry, Brooks managed to deliver maximalist cushioning without instability, making the Glycerin Max 2 a go-to choice for runners who want comfort above all else.
ㅤ
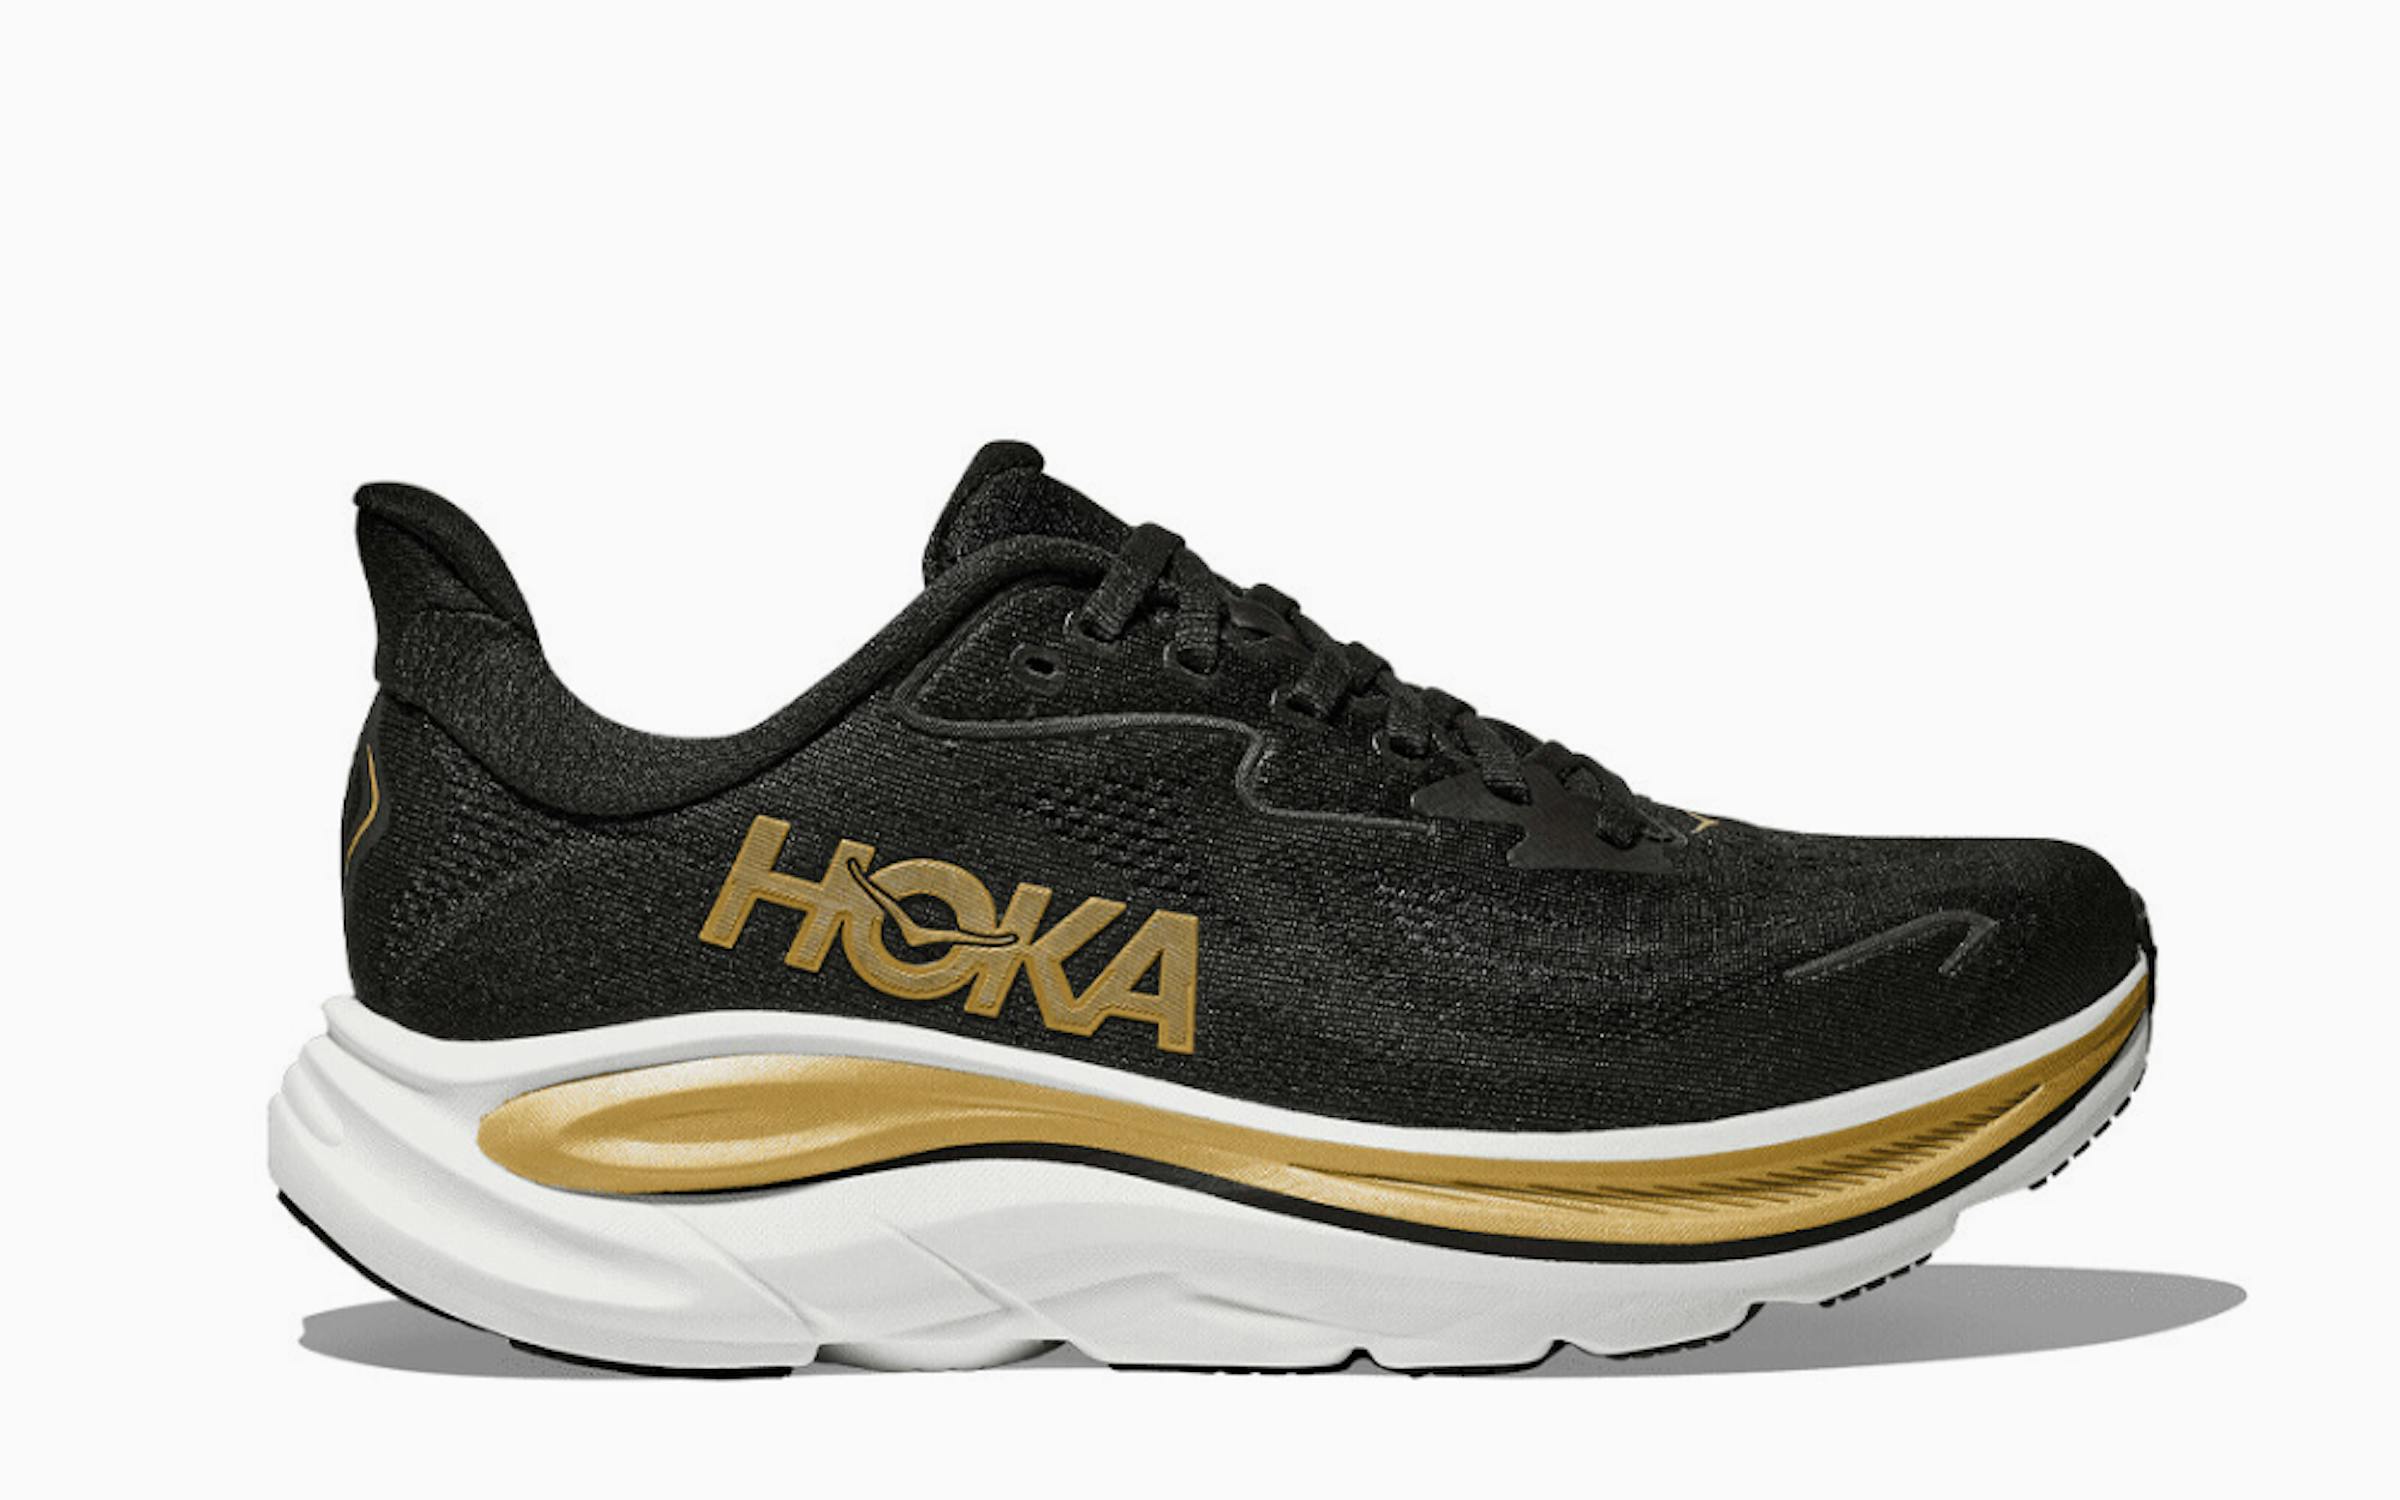
HOKA: Clifton 10
Celebrating a decade of popularity, the Clifton 10 is the most refined iteration of Hoka’s iconic everyday trainer. This year’s model amplifies its signature smooth roll with improved MetaRocker™ geometry and a slightly softer CMEVA 2.0 foam, giving the shoe a new era of plush performance. The Clifton remains one of the most popular shoes on the road, soft enough for easy days, stable enough for higher mileage, and easy to slot into any daily rotation. The 10th edition shows how a timeless design can evolve without losing the qualities that keep runners coming back for more.
ㅤ
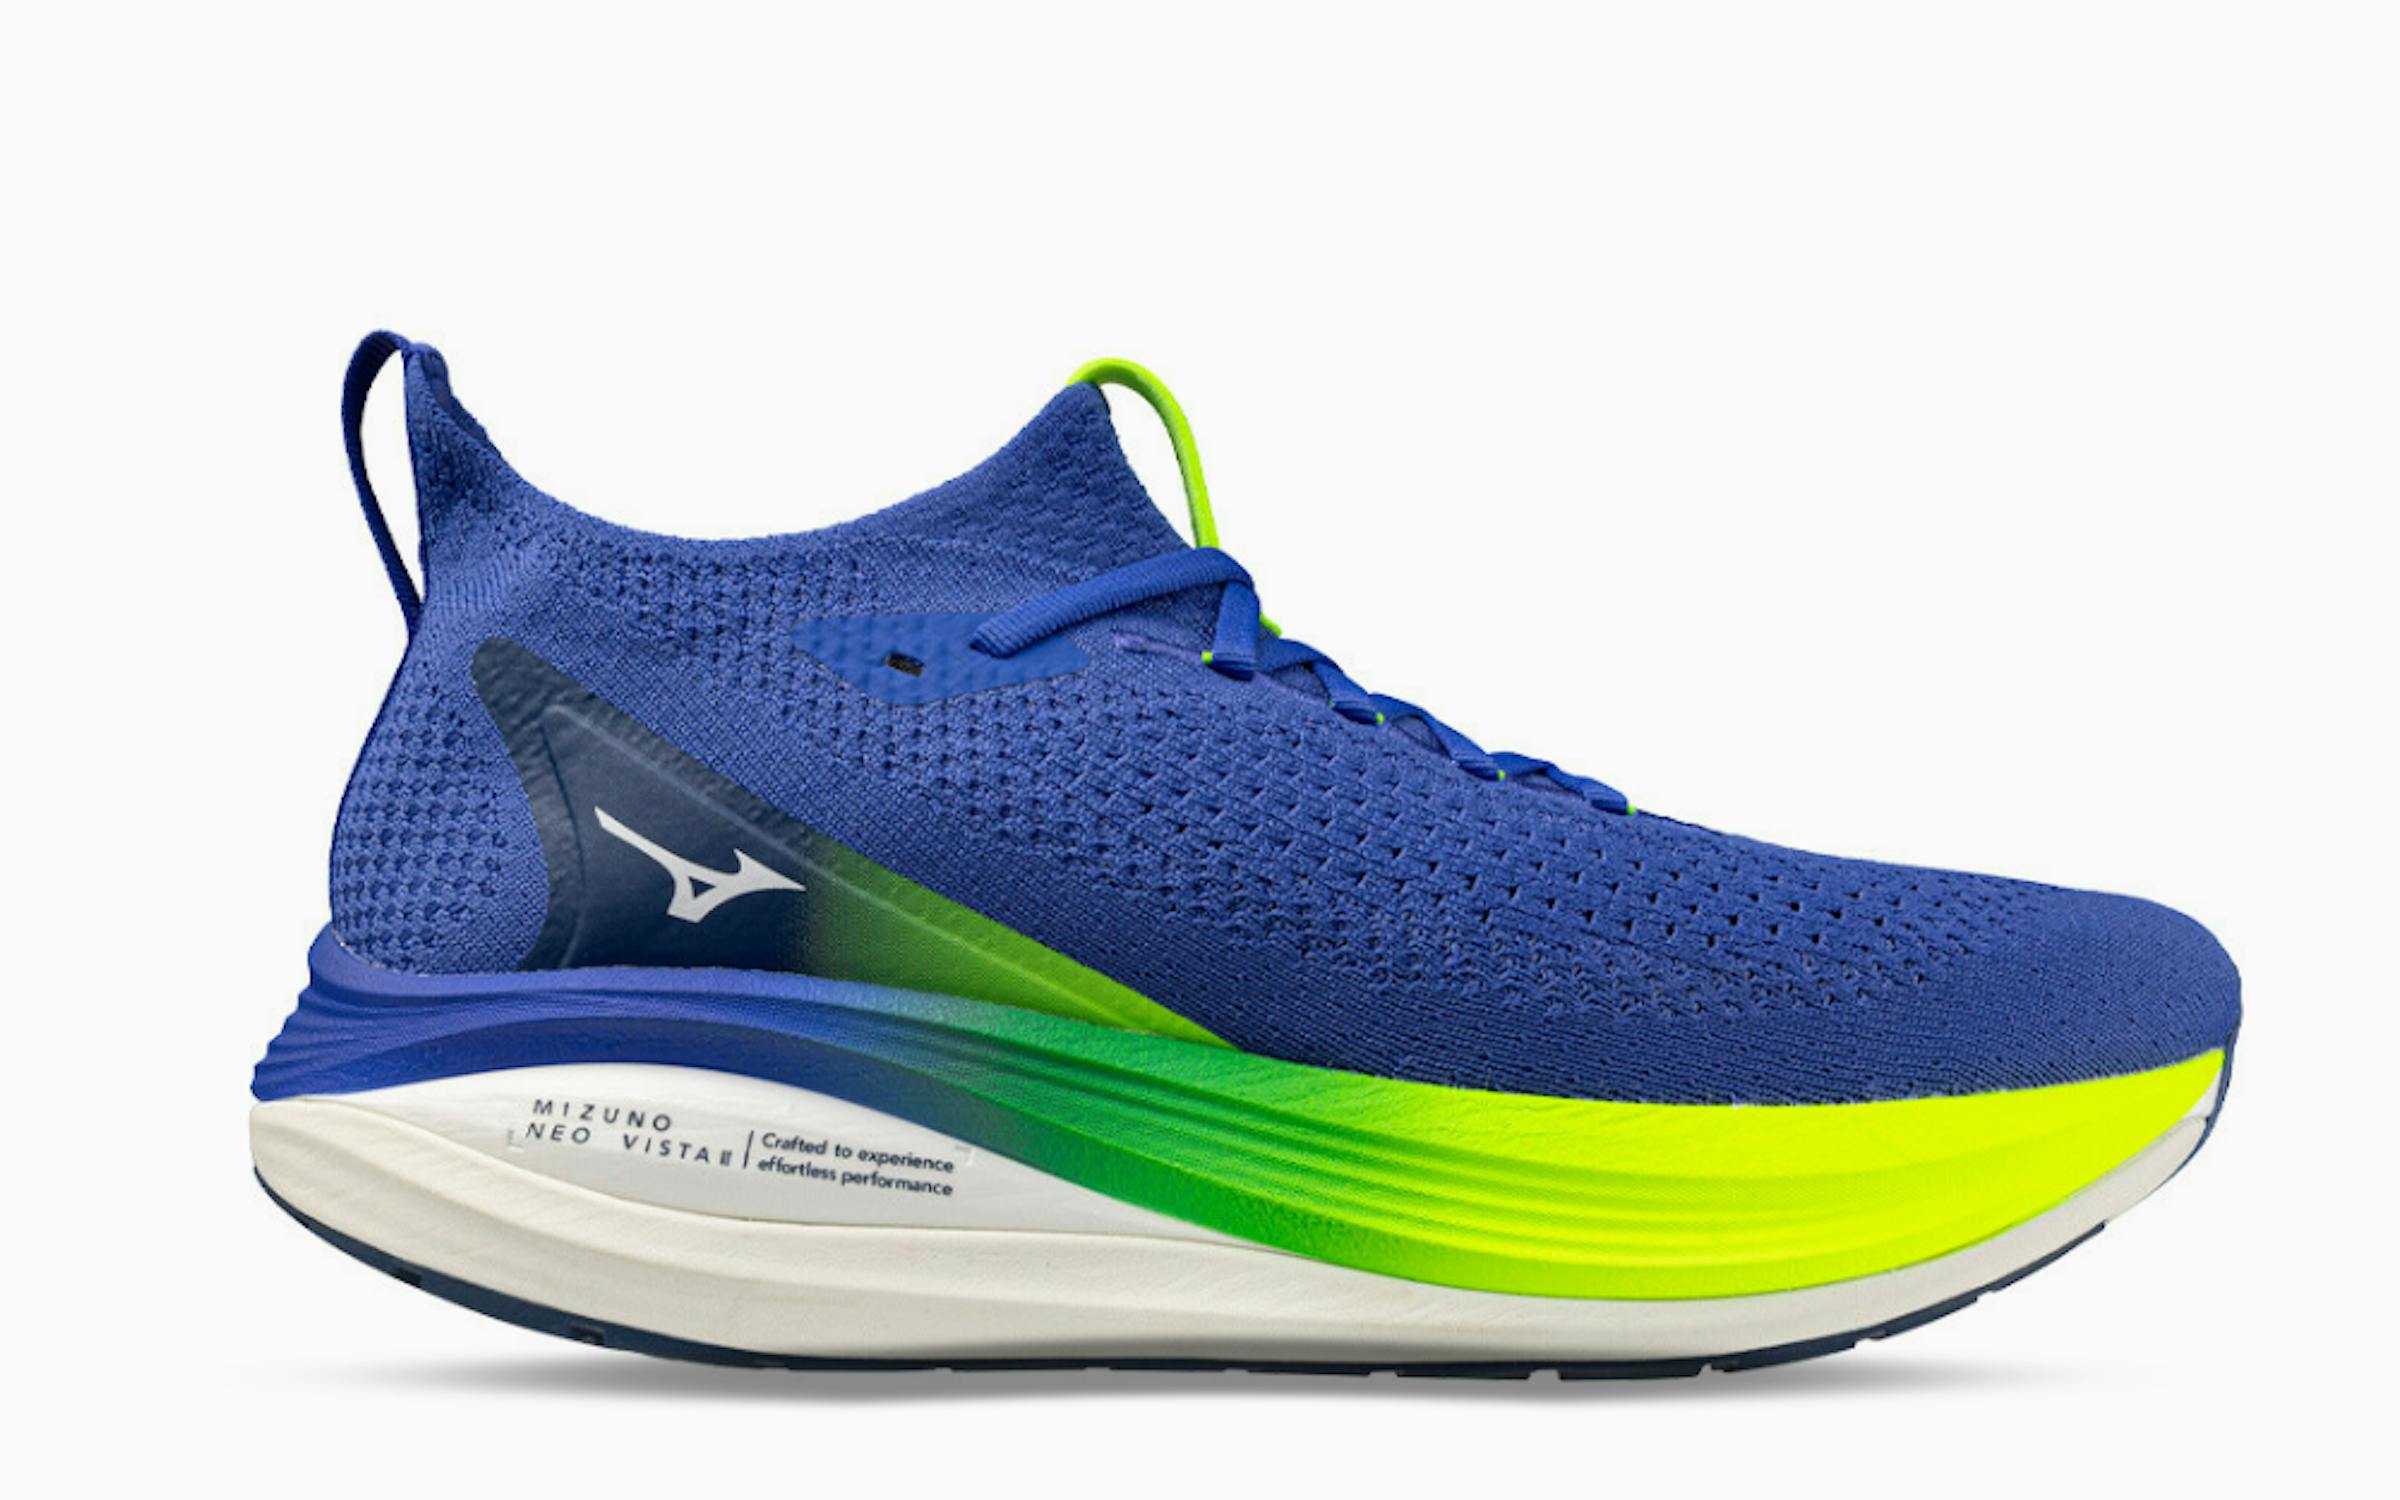
Mizuno: Neo Vista 2
The Neo Vista 2 takes everything runners loved about the original and pushes it further. Its dual-layer nitrogen-infused Enerzy NXT foam delivers a ride that’s both plush and surprisingly lively, blending protection and propulsion in a way that feels genuinely fun and easy to run in every day. Up top, the updated breathable knit upper offers a soft, comfortable, sock-like fit with improved mid-foot lockdown and plenty of room where it counts. It’s a modern twist on Mizuno’s more structured designs, and this softer, bouncier ride earns its spot as one of the most interesting high-cushioned shoes of 2025.
ㅤ
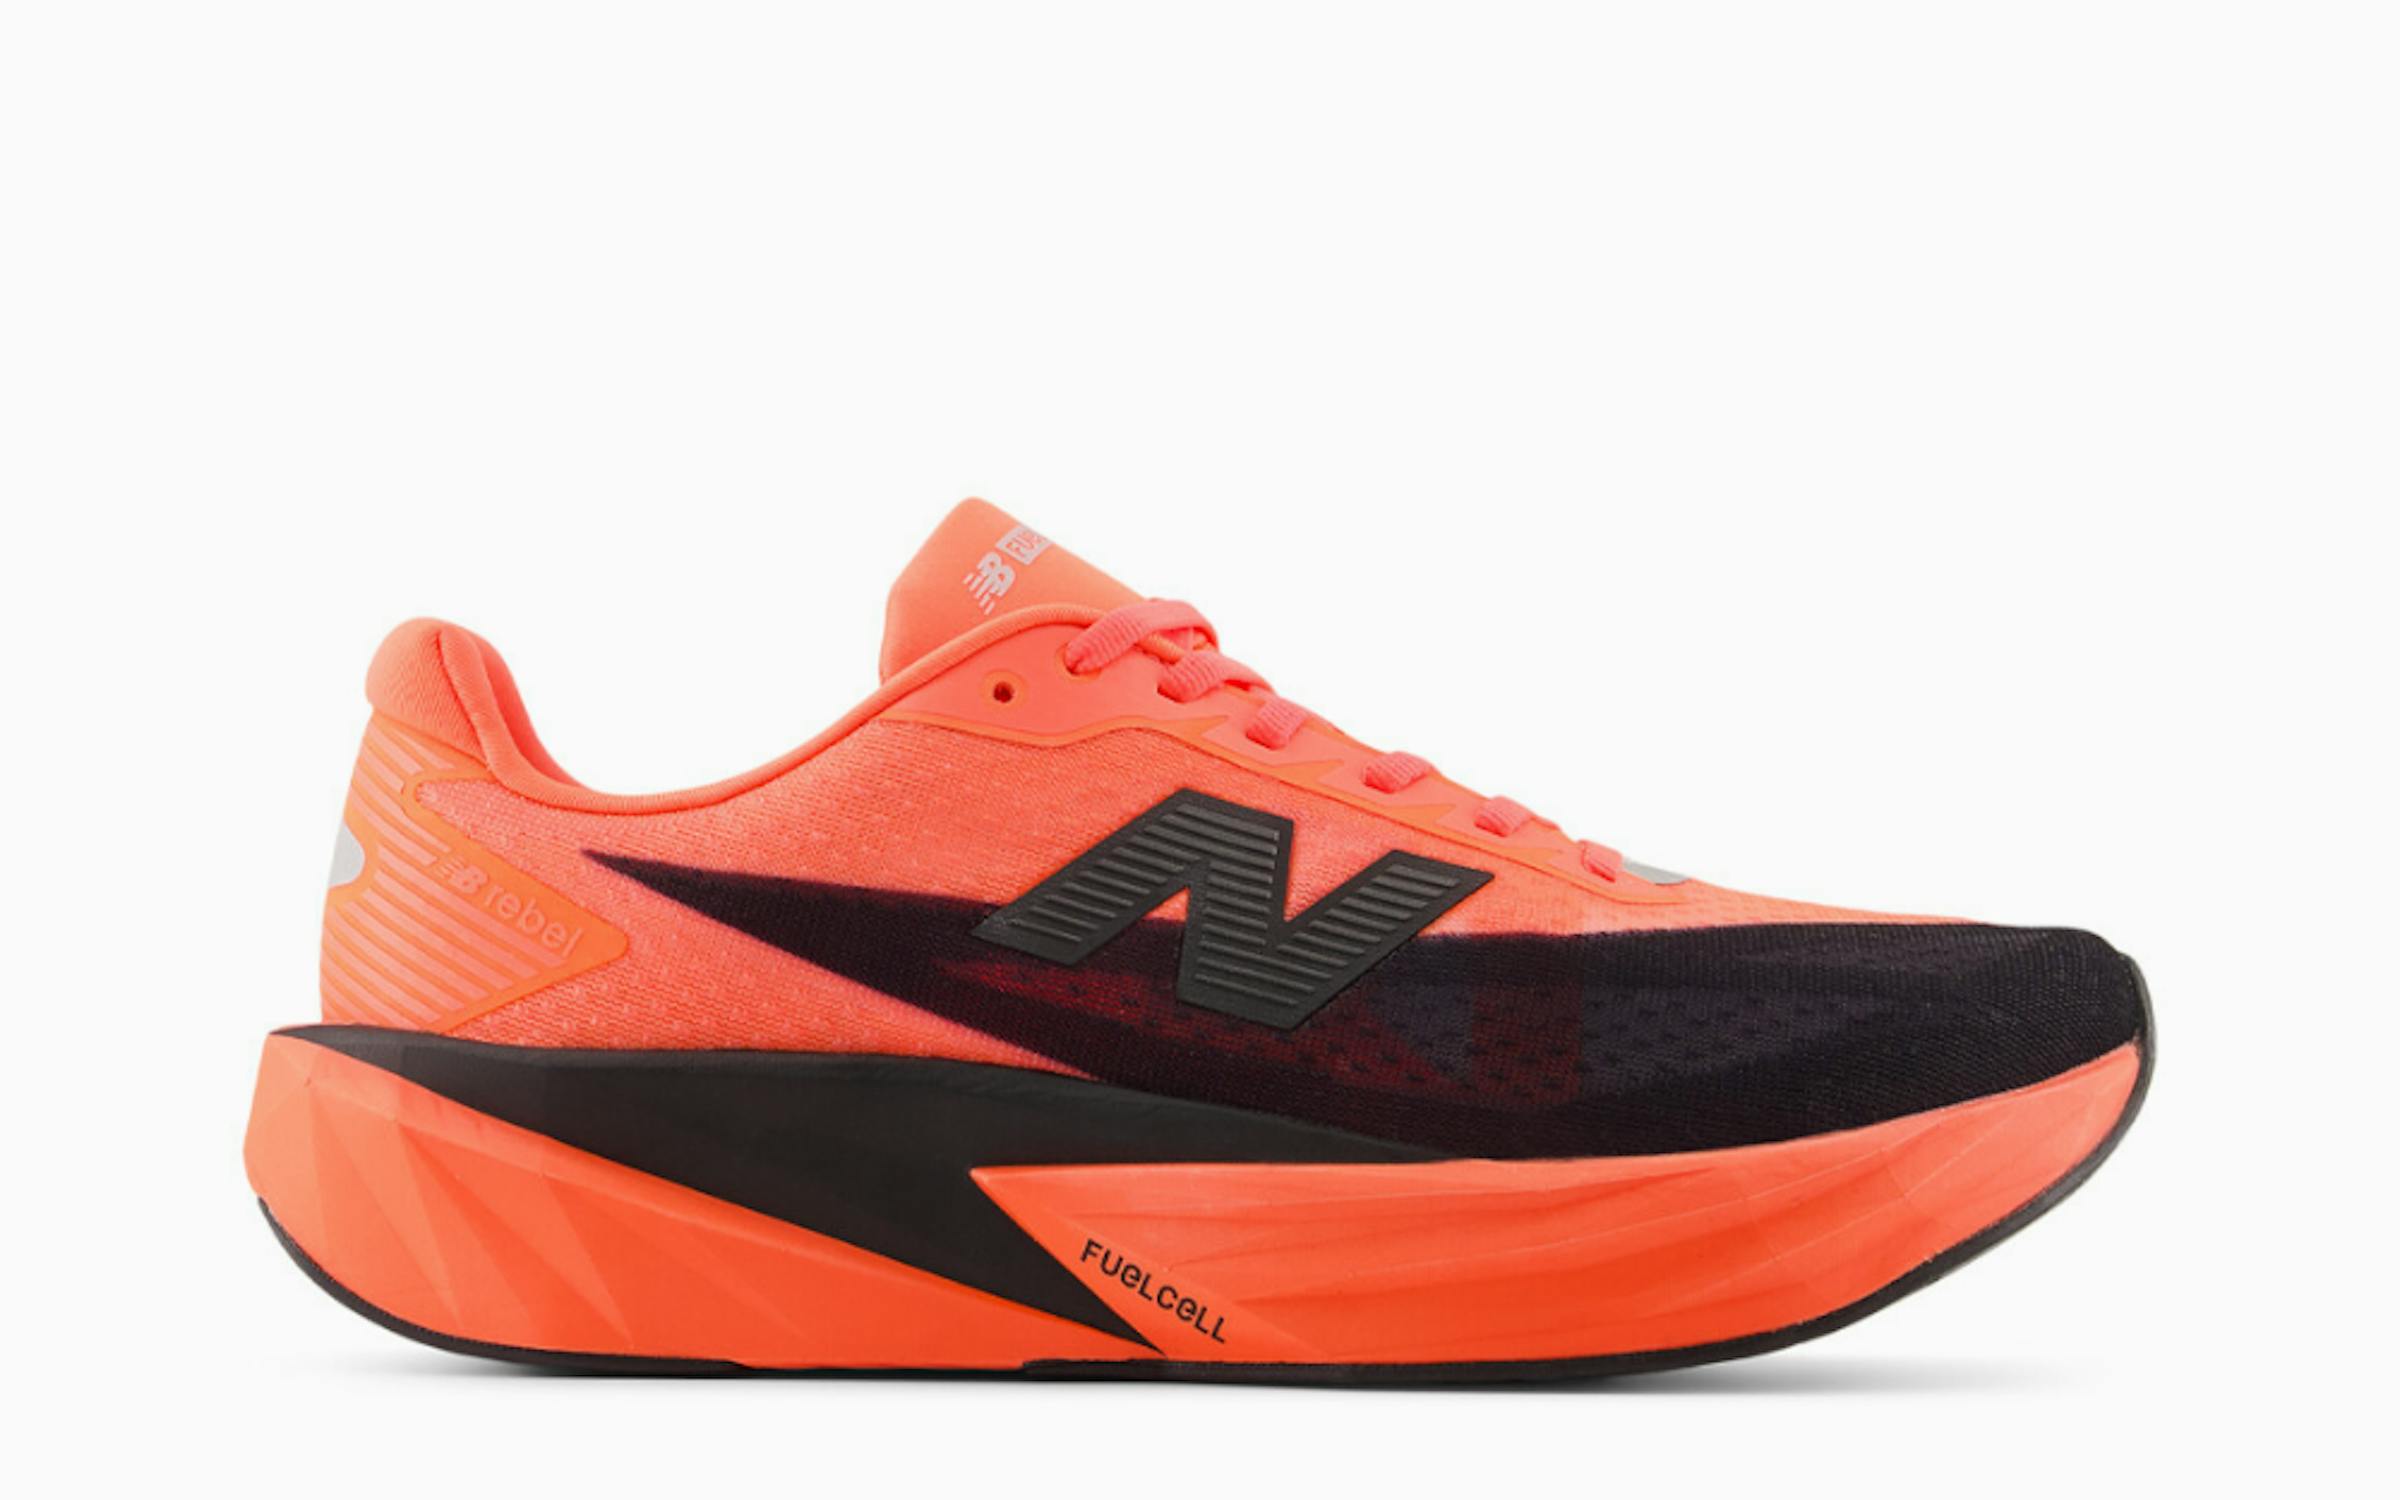
New Balance: FuelCell Rebel v5
The Rebel series has always been about fast, fun, energetic running. The updated FuelCell foam, a blend of PEBA and EVA, delivers a lively toe-off, while the redesigned upper offers a race-like locked-in fit without compromising comfort. Light enough for tempo runs but cushioned enough for daily miles, the Rebel v5 is the do-everything shoe on this list, and a shoe that nearly every runner can find use for. The bold, modern style stands out from the crowd, meaning it’s just as easy to wear to a coffee shop as it is to your next session.
ㅤ
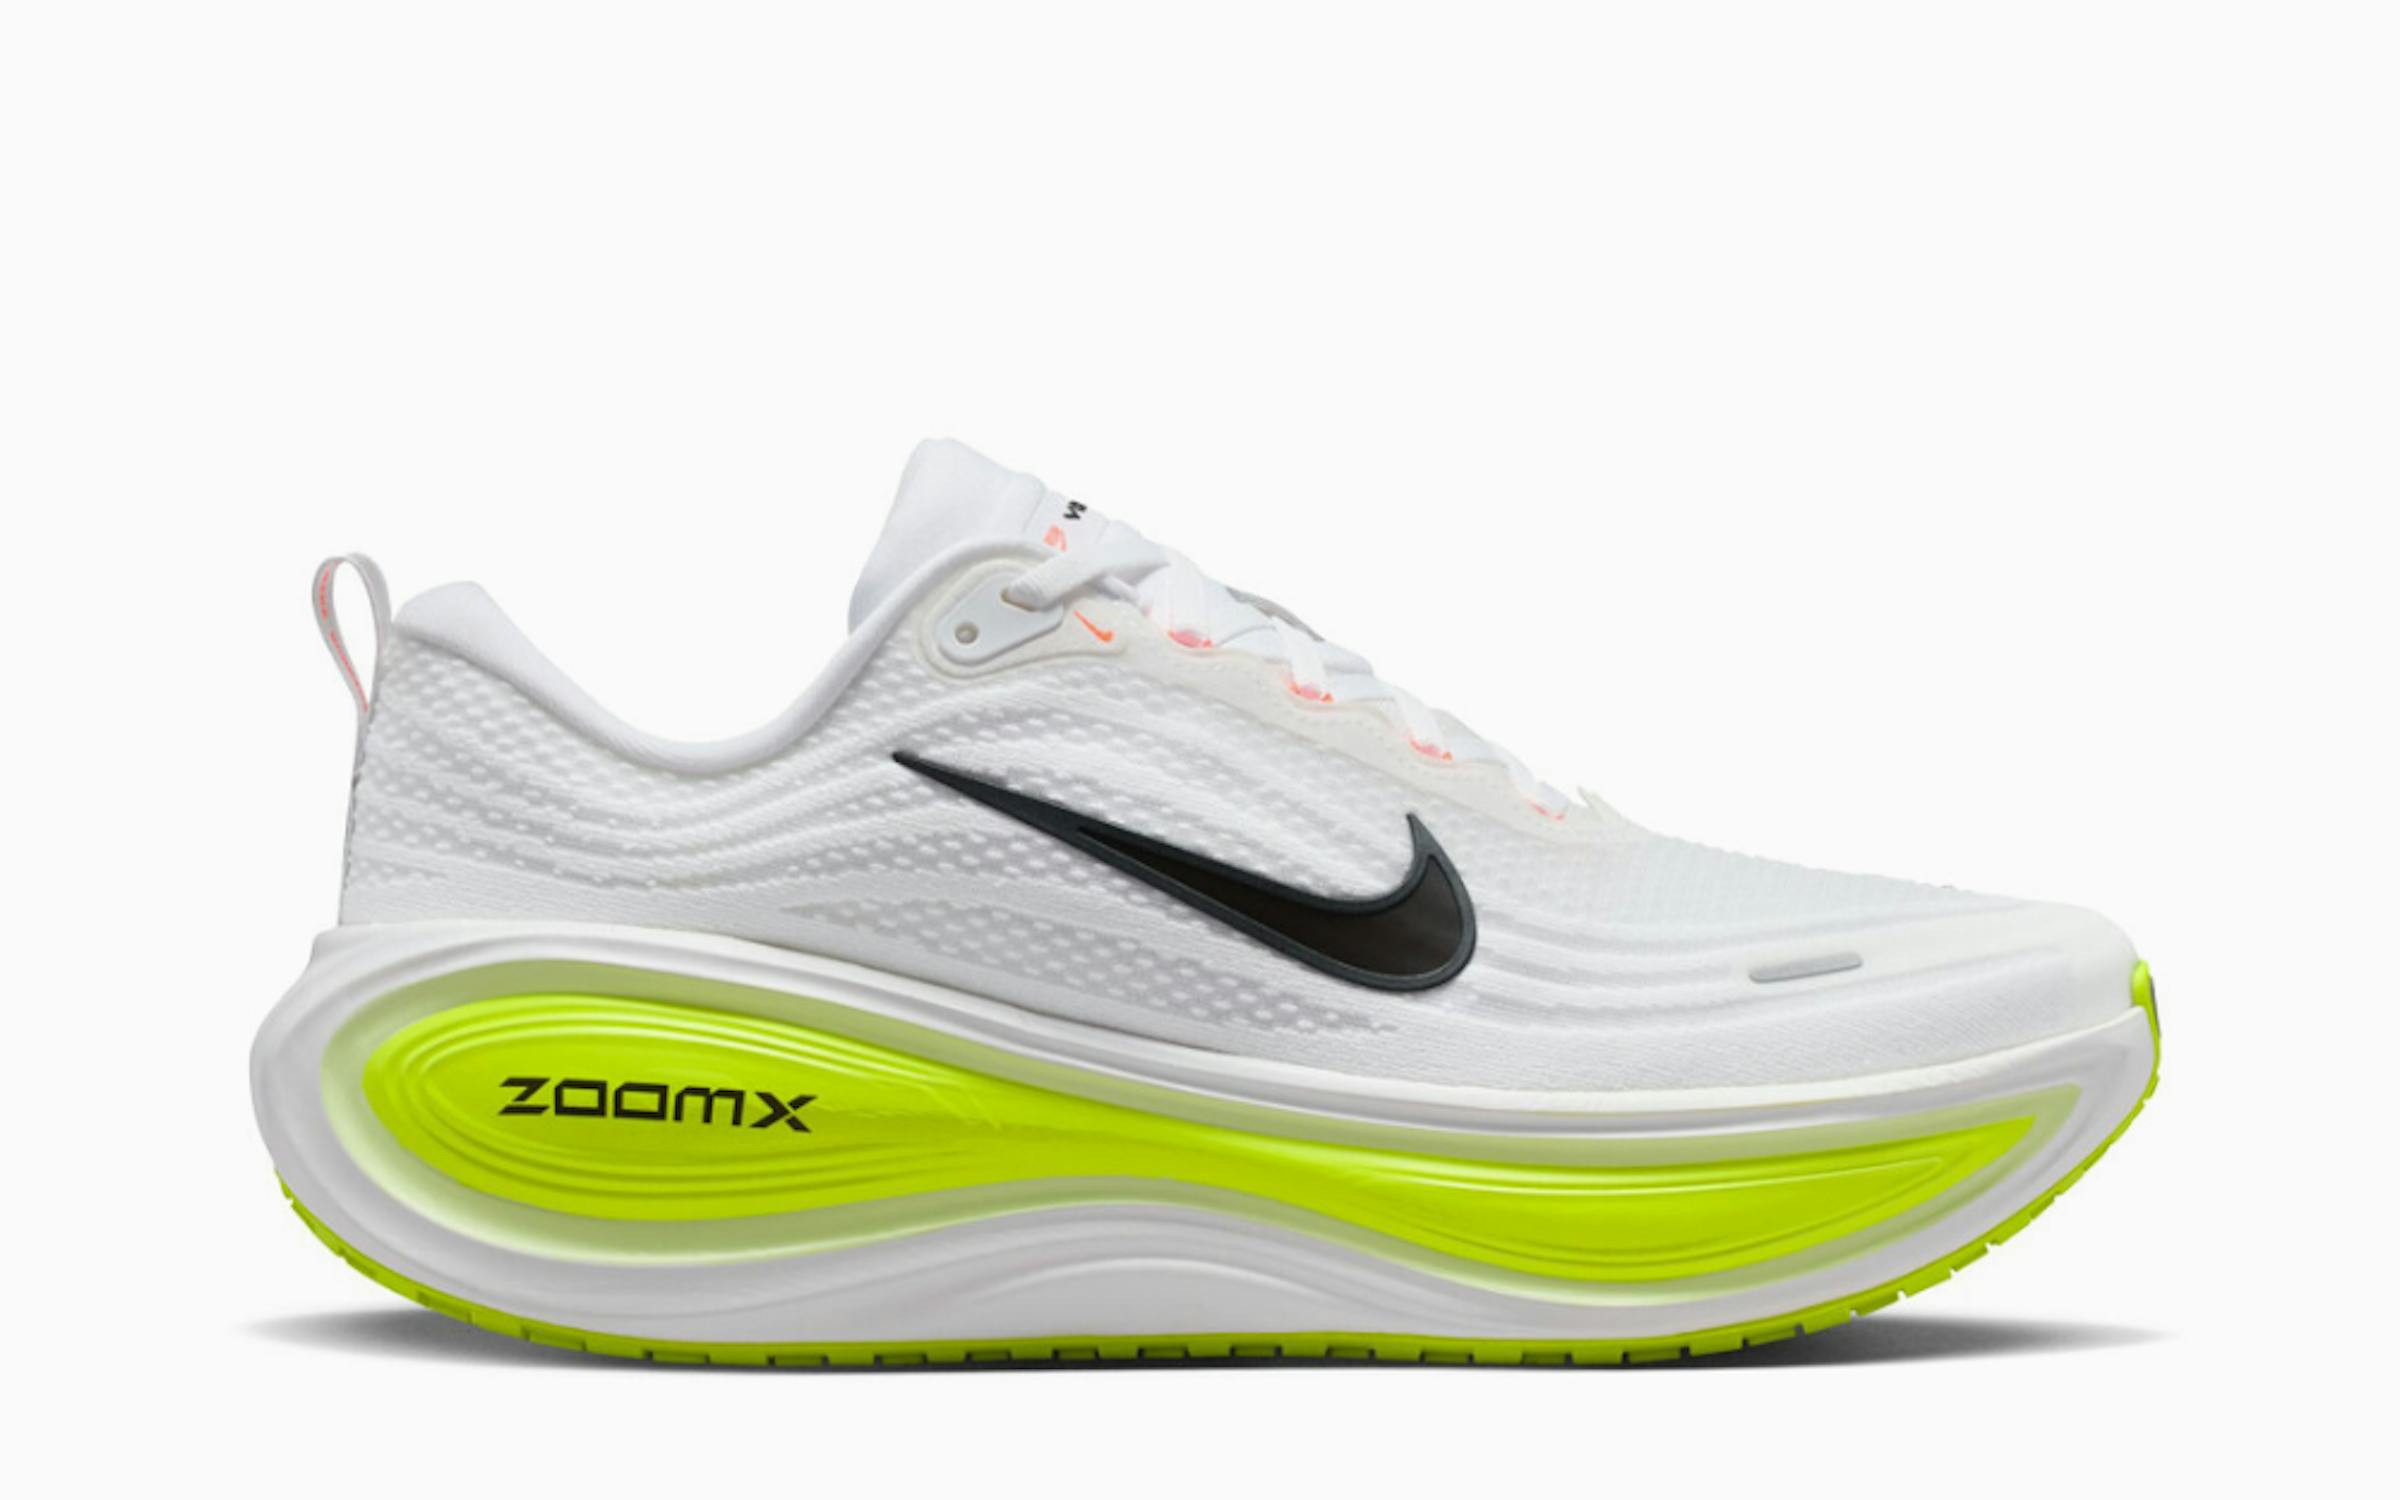
Nike: Vomero Plus
The Vomero line has had a renaissance in recent years, and the Vomero Plus is the boldest interpretation yet, with a full-length ZoomX foam midsole engineered for ultimate comfort and rebound. This shoe is the big brother to Vomero 18, delivering maximalist cushioning that appeals to dedicated runners seeking a super plush ride that doesn’t sacrifice responsiveness. The Vomero Plus has strengthened Nike’s position in the premium cushioning segment, offering a soft and energetic alternative to the Pegasus and Invincible.
ㅤ
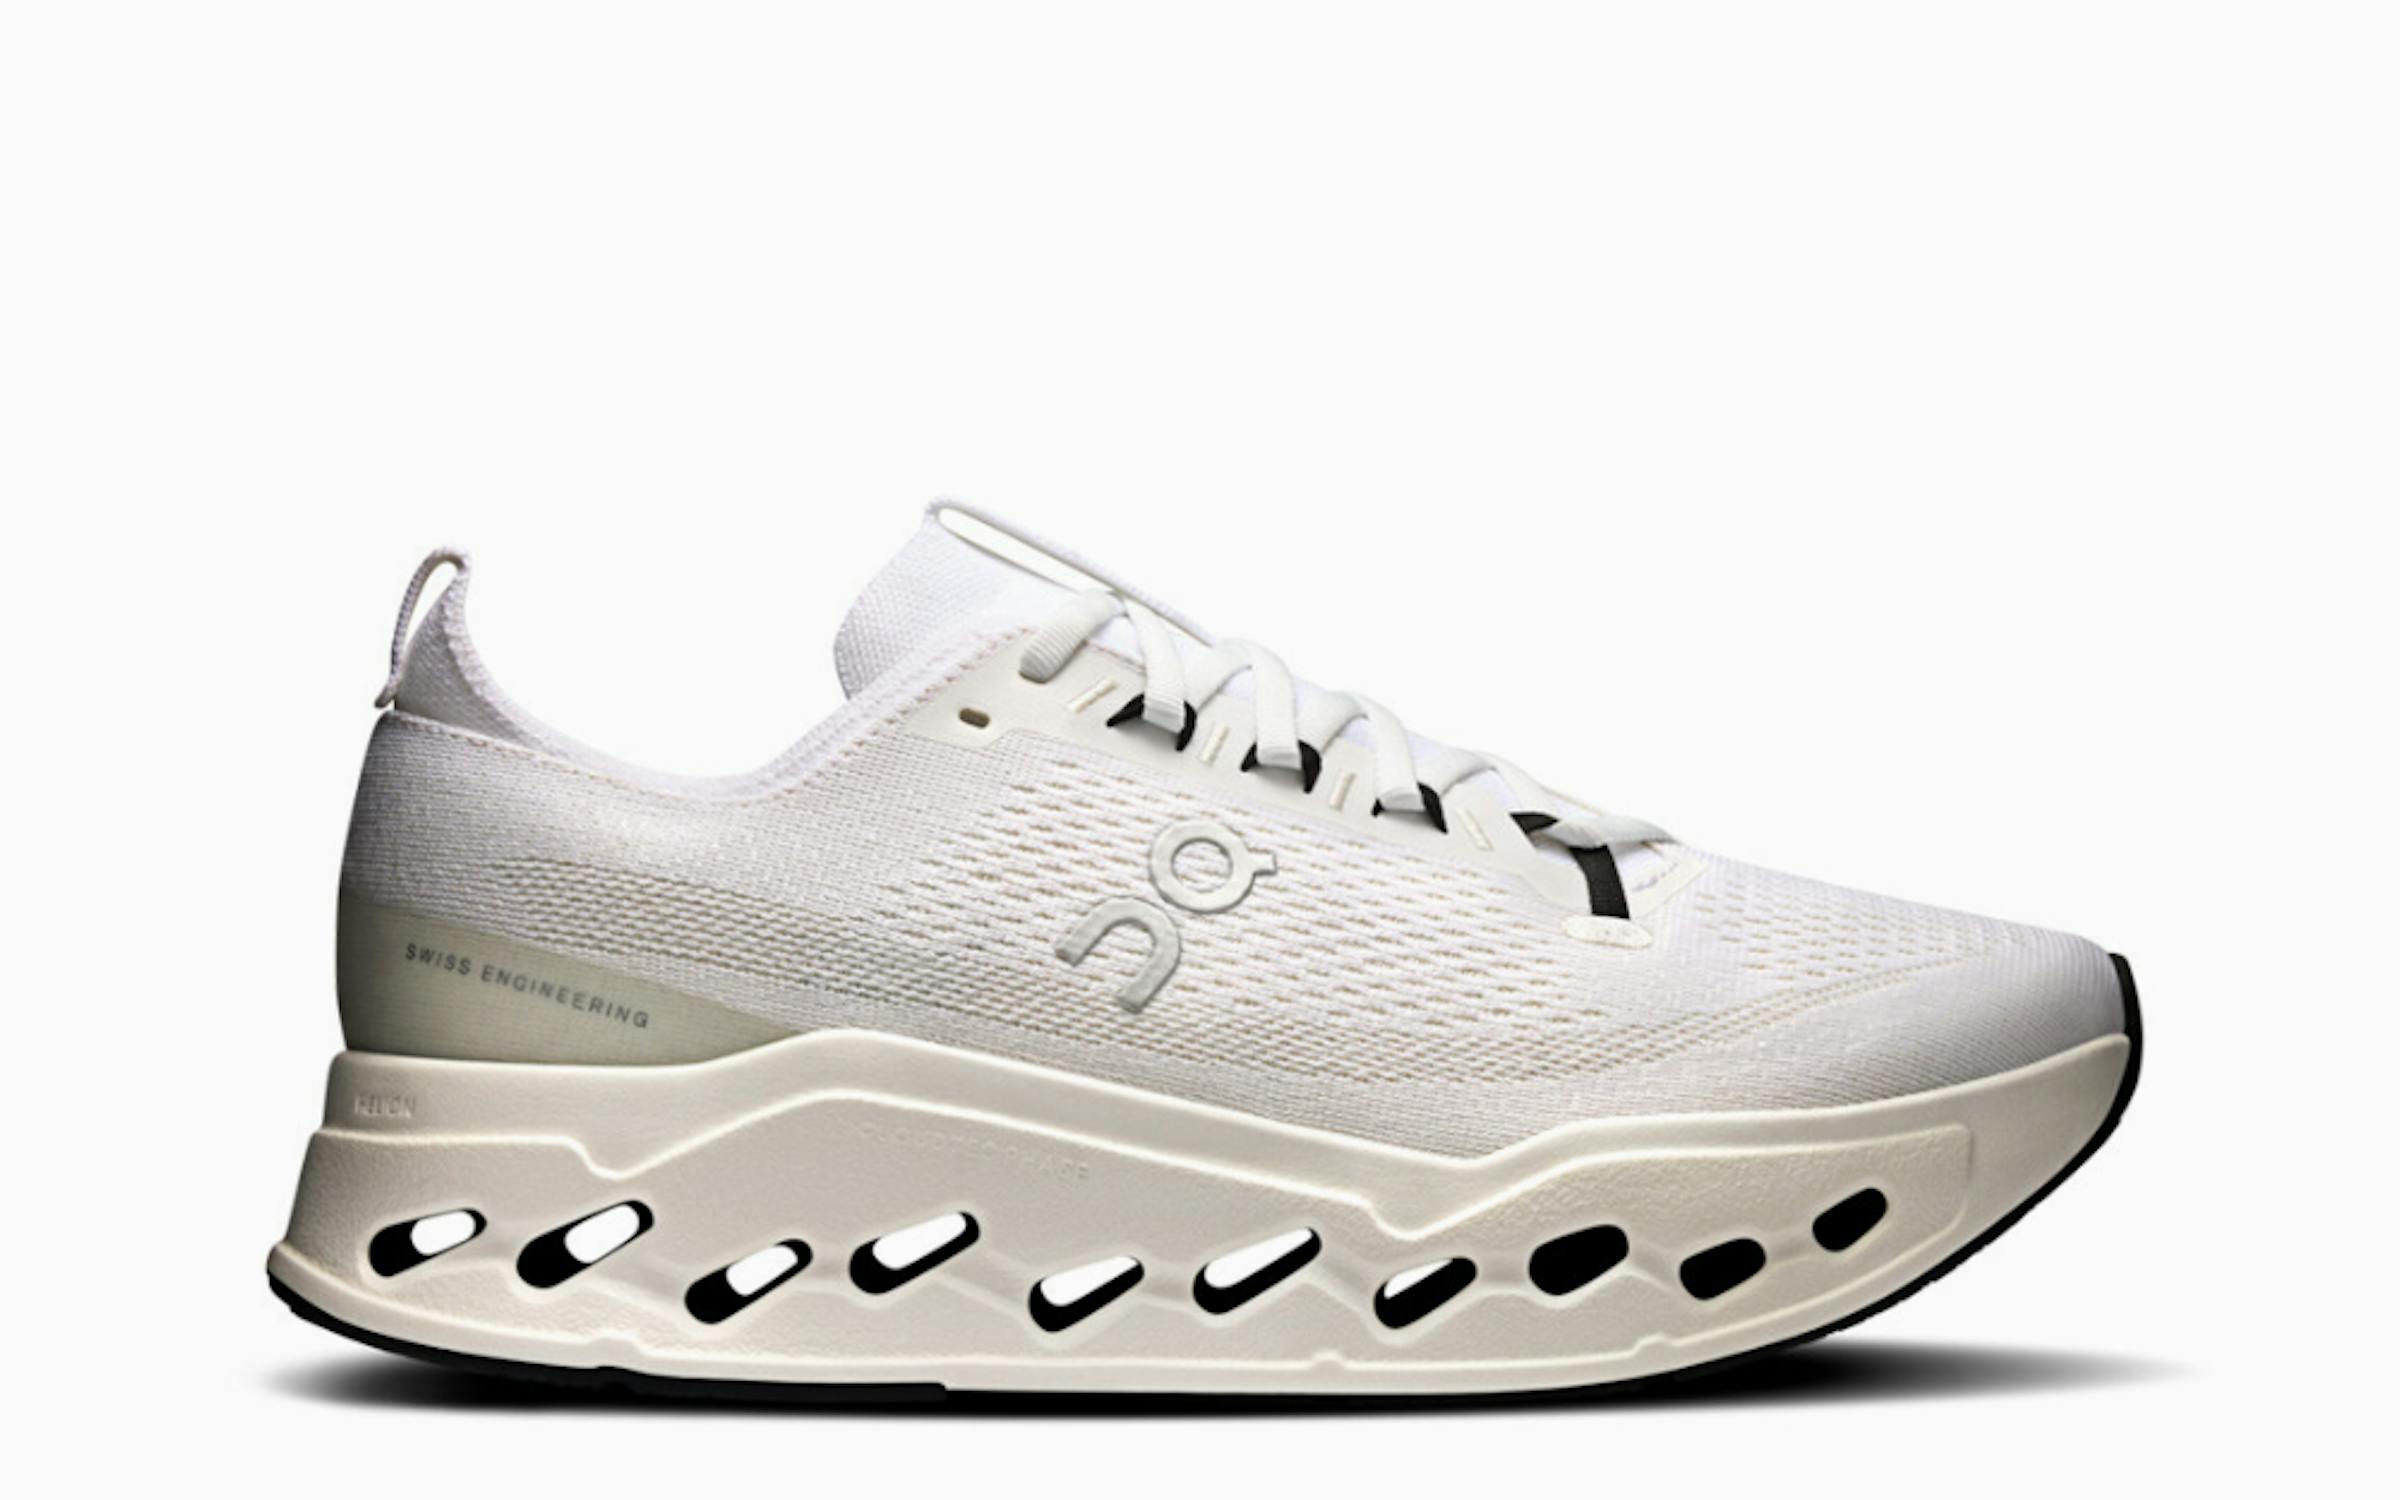
On: Cloudsurfer Max
The Cloudsurfer Max takes everything runners love about the Cloudsurfer 2 and elevates it with a softer, more cushioned platform built for long, effortless miles. Using a double layer of computer-optimised CloudTec Phase™, On’s signature cushioning design collapses in sequence as your foot lands for ultra-smooth heel-to-toe transitions. Helion™ superfoam works alongside the CloudTec Phase™ system to absorb impact and keep landings plush, while the engineered mesh upper adds breathability and all-day comfort.
ㅤ
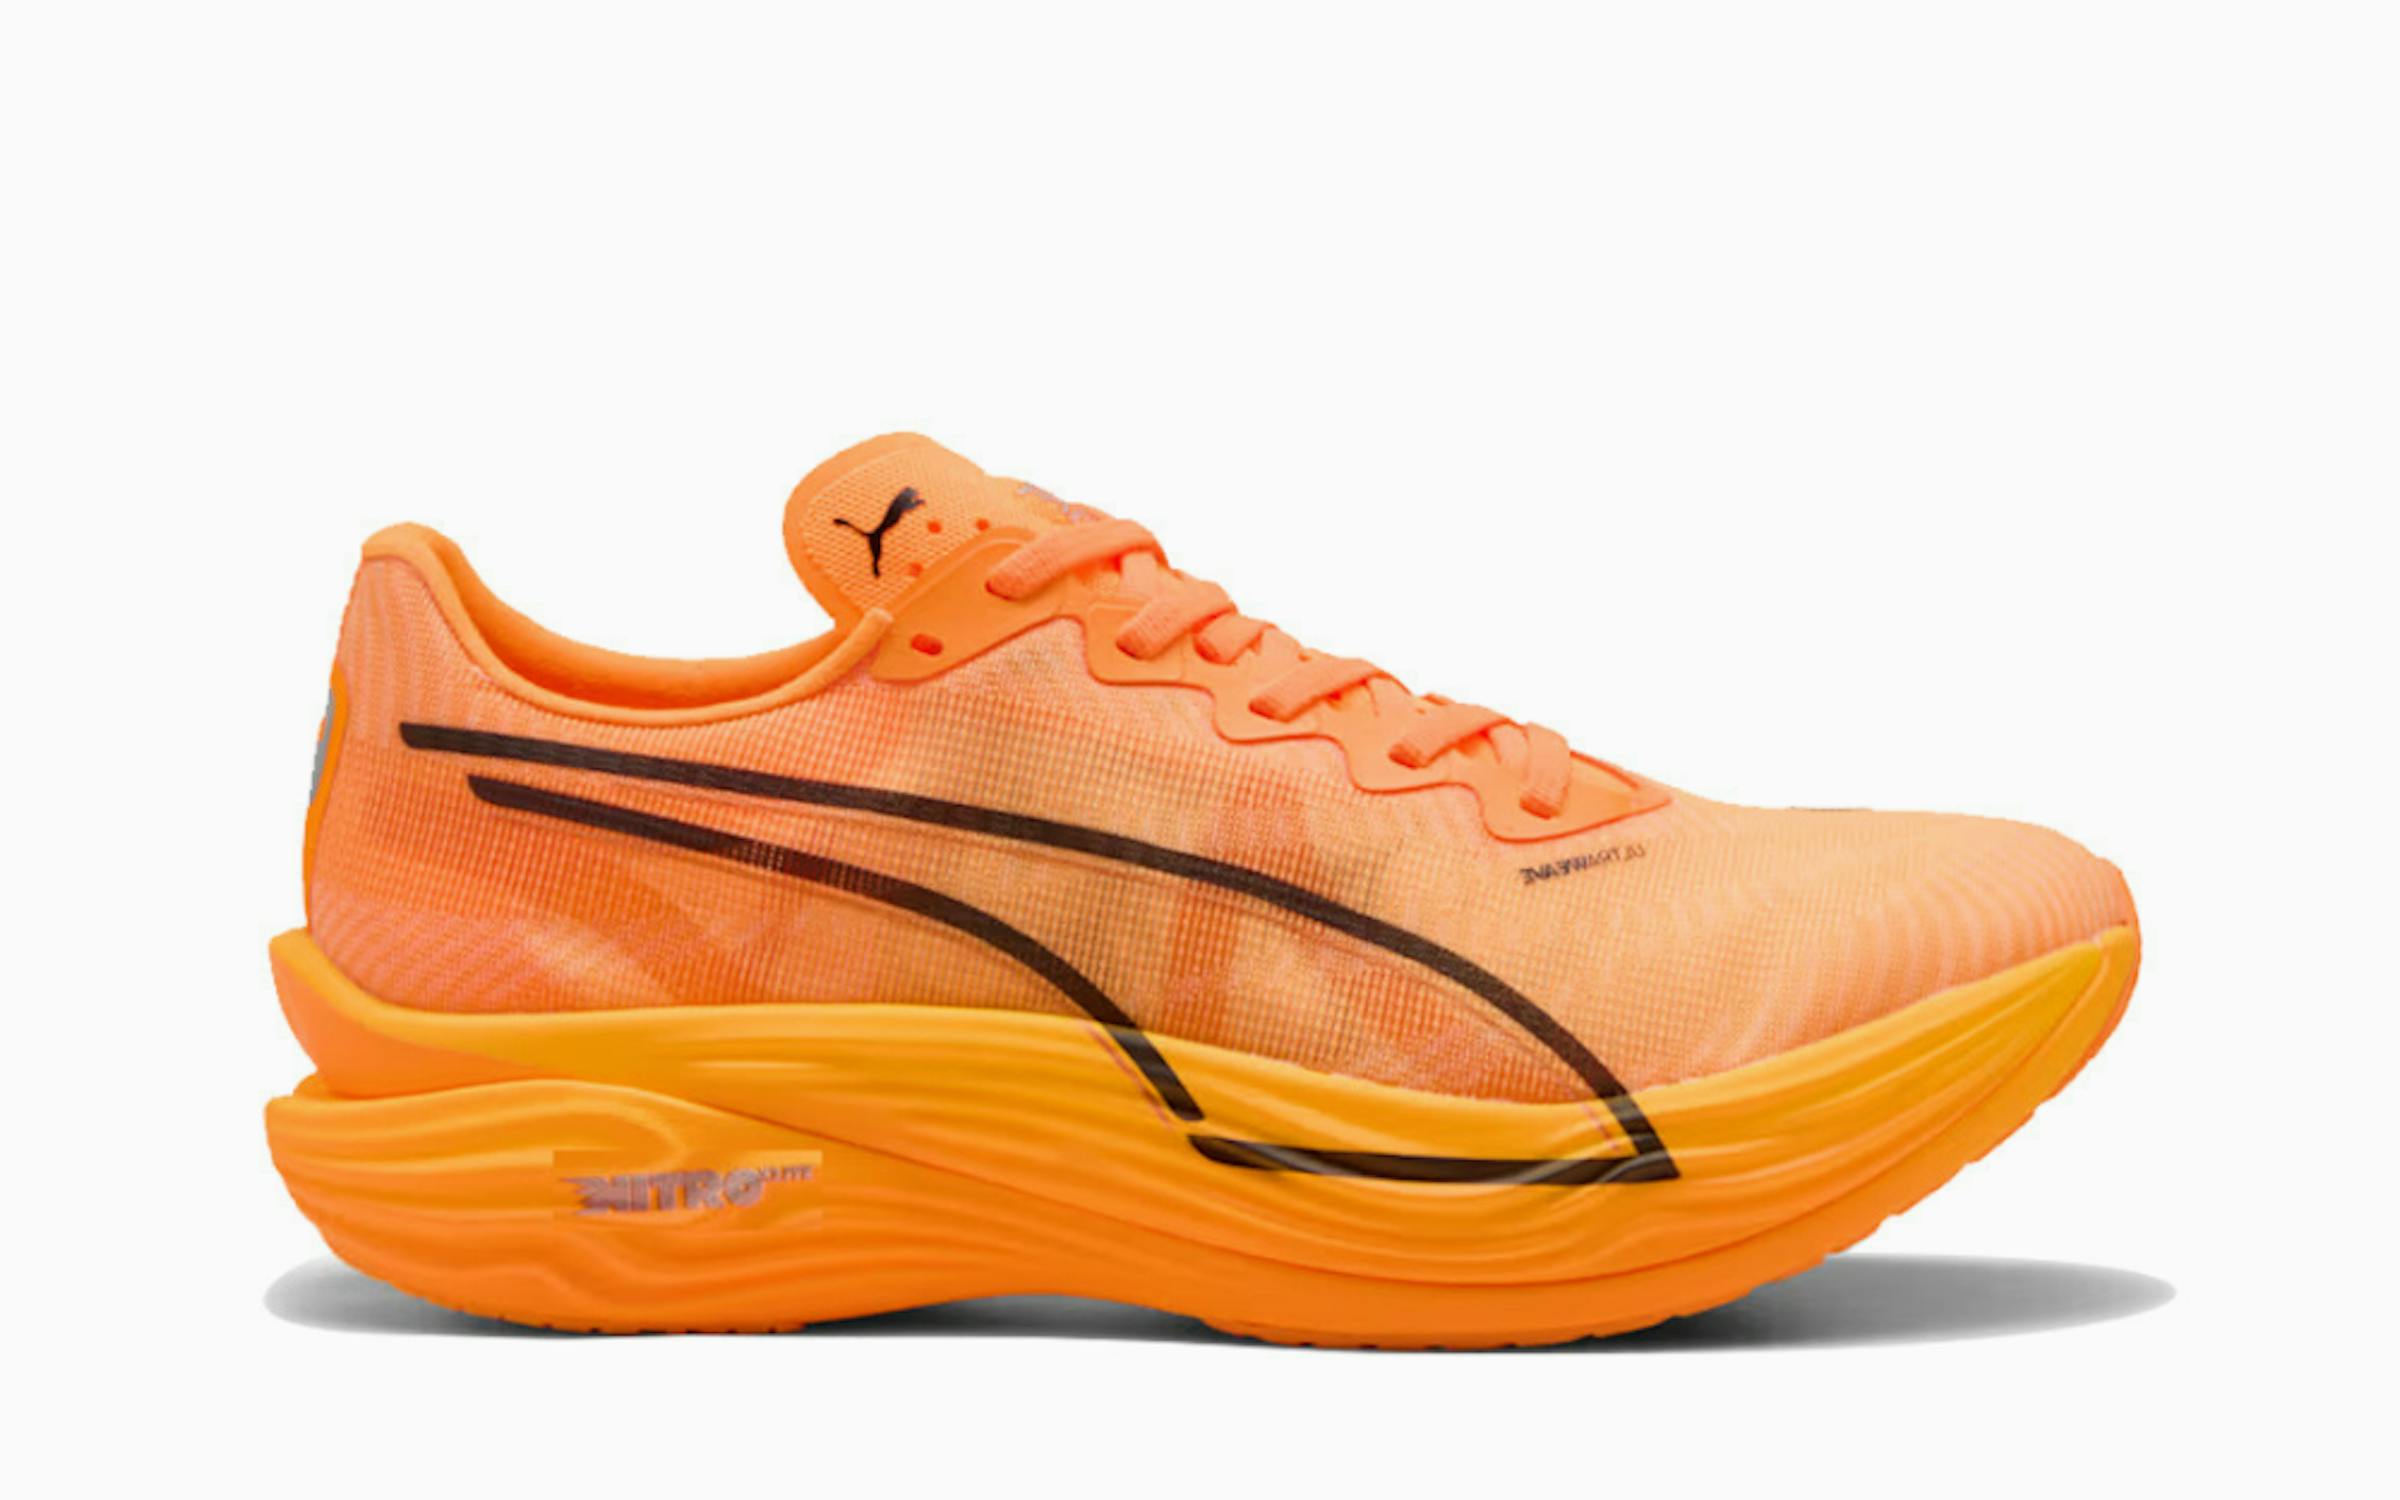
Puma: Deviate Nitro Elite 3
Puma continues to impress with its plated racing line, and the Deviate Nitro Elite 3 is one of their most fine-tuned carbon shoes of the year. Featherlight Nitro Elite foam pairs with a precision-engineered plate for a quick, highly efficient ride. It’s a rare carbon racer that feels accessible, fast enough for elite performance but forgiving enough for sub-elite runners looking for a shoe that won’t punish them late in the race.
ㅤ
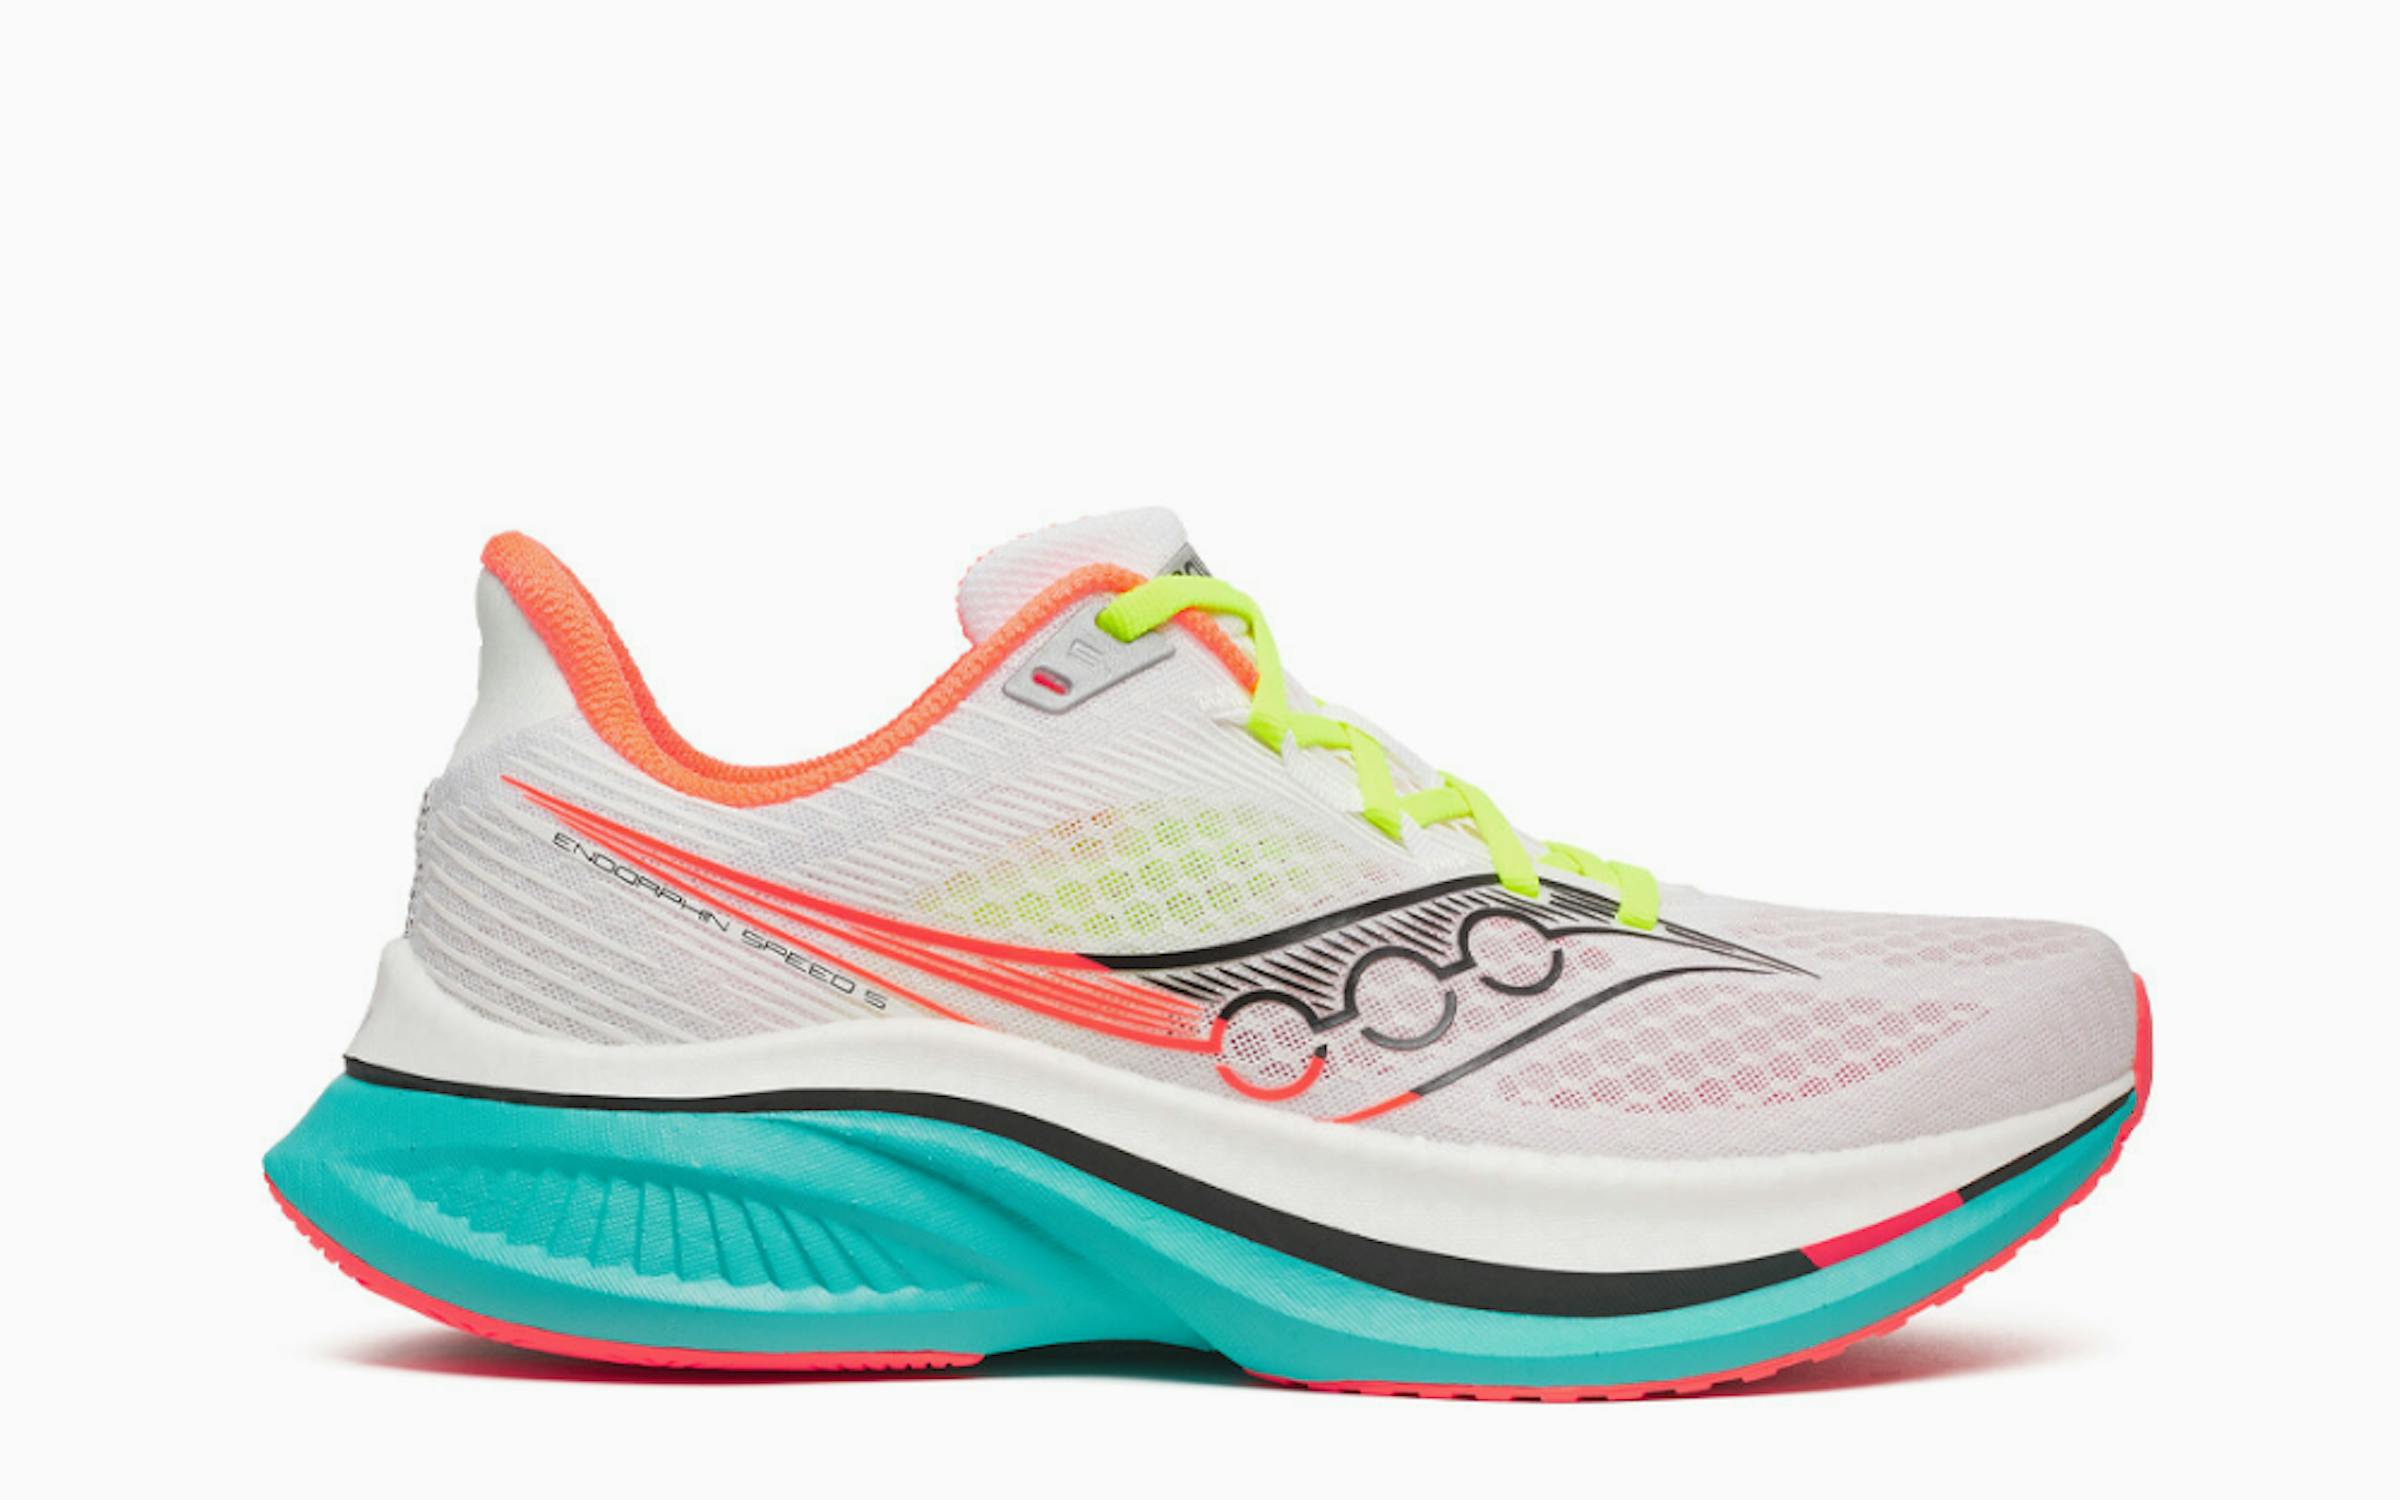
Saucony: Endorphin Speed 5
The fifth generation of the Endorphin Speed debuts a refreshed nylon plate and an updated PWRRUN PB+ foam, offering a blend of responsiveness and cushioning that excels in tempo sessions, speed work and mid-distance racing. The Speed 5 is the ultimate all-rounder, light, comfortable and accessible, designed for runners who want race-day energy in their daily training without the carbon plate.
ㅤ
Competitive Running
In Numbers:
• 54% of runners took part in some sort of competitive running in 2025
• 5K events were the most popular, a fifth of all runners having done one last year
• Men are more likely to take part in a competitive run, 57% of men did so in 2025 compared to 50% of women
• 61% of runners are considering entering a race in 2026
• It’s Gen Z showing the most interest, over three quarters (76%) of Gen Z runners are considering competitive running in 2026
ㅤ
ㅤ
In 2025, over half of runners (54%) took part in at least one organised running event, showing how races and challenges have moved beyond niche appeal and into the mainstream. Participation is heavily driven by younger generations.
ㅤ
Gen Z runners are the most likely to be taking part in these events, with 69% having competed in 2025, followed by 60% of millennials. Participation then drops among older age groups, with 40% of Gen X and just 25% of baby boomers taking part in competitive events.
ㅤ
Men are also more likely to compete in a running event than women, 57% of men compared to 50% of women.
ㅤ
This appetite for competition is also reflected in current training habits. Nearly half of all runners (48%) say they are actively training for a competitive event.
ㅤ
Shorter, more accessible races are the most popular when it comes to types of competitive events people are taking part in. 5k races were the most completed event in 2025 with 20% of runners taking part, closely followed by fun runs (17%). The higher participation in lower-barrier events compared to longer-distance races may suggest convenience or achievable goals to be key motivators.
ㅤ
While endurance events such as half marathons (8%) and marathons (6%) continue to attract runners, obstacle and hybrid fitness races like CrossFit competitions (6%), Tough Mudder (4%) and Spartan Race (4%) also feature prominently, highlighting the growing overlap between running, fitness and challenge-based events.
ㅤ

ㅤ
Interest in competitive running shows no signs of slowing. Six in 10 runners (61%) are considering entering an event in 2026, rising sharply among younger age groups. Over three quarters of Gen Z runners (76%) say they are considering competitive running next year, compared to 67% of millennials, 47% of Gen X and 31% of baby boomers.
ㅤ
Although this enthusiasm is great to see, Gary warns not to take on too much too quickly when it comes to races and competitions: “When choosing races to enter it's now easy to get carried away with maybe too many races, tackling a distance that is too far too soon or even terrain that you’re not used to. Not so long ago the running event calendar would be pretty spread out, but now you can race any distance, any terrain most weekends. While I am a fan of some naivety in running and making some mistakes along the way, it’s important to minimise some risk of failure by not overloading yourself too soon.”
ㅤ
The Most In-Demand Marathons in the World
ㅤ

Photo credits: Albatros Adventure Marathons
ㅤ
Marathon running is more popular than ever, with nearly 10% of runners considering taking on 26.2 miles this year. For many runners, these races double up as a way to see the world, from city streets lined with skyscrapers to more remote mountain trails and frozen deserts. But while plenty of marathons welcome thousands of finishers, others are far harder to get into, with demand massively outstripping the number of available places.
ㅤ
To find out which are the most in-demand marathons worldwide for 2026, we analysed global monthly Google search volumes over the past 12 months and compared them to official finisher totals from each event’s latest edition. This reveals where competition for a place is fiercest and which events runners are most eager to experience.
ㅤ
The top three spots of the global ranking are dominated by destination races, with South Africa’s Big Five Marathon, the Antarctic Ice Marathon and China’s Great Wall Marathon all attracting far more interest than their limited fields can accommodate. Their remote settings and challenging courses highlight how many runners are searching for memorable, once-in-a-lifetime experiences.
ㅤ
Switzerland is the most represented country in the global top 10, with two of its races placing in the top six, which could reflect the strong appeal of its mountain and lakeside routes.
ㅤ
The Top 20 Most In-Demand Marathons Worldwide for 2025
| RANK & MARATHON NAME | LOCATION | FINISHERS IN LATEST EDITION | GOOGLE SEARCHES IN 2025 | DEMAND SCORE (SEARCHES PER FINISHER) |
| 1. Big Five Marathon | South Africa | 99 | 44,000 | 444.4 |
| 2. Antarctic Ice Marathon | Antarctica | 65 | 22,520 | 346.5 |
| 3. Great Wall Marathon | China | 334 | 64,500 | 193.1 |
| 4. Zermatt Marathon | Switzerland | 462 | 37,500 | 81.2 |
| 5. Boston Marathon | USA | 28,381 | 2,154,000 | 75.9 |
| 6. Lausanne Marathon | Switzerland | 1,851 | 127,100 | 68.7 |
| 7. Zagreb Marathon | Croatia | 656 | 43,200 | 65.9 |
| 8. Reykjavík Marathon | Iceland | 519 | 31,100 | 59.9 |
| 9. Dubai Marathon | UAE | 1,800 | 98,300 | 54.6 |
| 10. Midnight Sun Marathon | Norway | 1,570 | 85,100 | 54.2 |
| 11. Berlin Marathon | Germany | 17,100 | 890,900 | 52.1 |
| 12. Cork Marathon | Ireland | 1,942 | 99,000 | 51.0 |
| 13. Salzburg Marathon | Austria | 1,257 | 60,800 | 48.4 |
| 14. Helsinki City Marathon | Finland | 2,276 | 106,600 | 46.8 |
| 15. Niagara Falls International Marathon | Canada/USA | 950 | 43,300 | 45.6 |
| =16. Riyadh Marathon | Saudi Arabia | 607 | 27,550 | 45.4 |
| =16. Great Ocean Road Marathon | Australia | 1,853 | 84,100 | 45.4 |
| 18. Queenstown Marathon | New Zealand | 2,926 | 129,100 | 44.1 |
| 19. Graz Marathon | Austria | 1,138 | 49,180 | 43.2 |
| 20. Calgary Marathon | Canada | 1,932 | 82,700 | 42.8 |
ㅤ
1. Big Five Marathon, South Africa - 444.4 searches per finisher
A bucket-list race for adventurous runners, the Big Five Marathon takes place in the heart of a private game reserve, meaning competitors share their route with elephants, lions and other animals. With fewer than 100 finishers in 2025, demand heavily outweighs availability, cementing its position as the world’s most sought-after marathon experience.
ㅤ
2. Antarctic Ice Marathon - 346.5 searches per finisher
Few races are as extreme, or as exclusive, as the Antarctic Ice Marathon. With only 65 finishers in its most recent edition, this is the only official marathon held on mainland Antarctica and attracts runners looking to complete a race on all seven continents. The icy conditions, remote location and strict participant limits make it one of the hardest events to access, which results in extremely high demand compared with the number of finishers.
ㅤ
3. Great Wall Marathon, China - 193.1 searches per finisher
One of the world’s most iconic endurance challenges, the Great Wall Marathon combines ancient history with punishing elevation. Runners tackle thousands of steps along the famous landmark, with breathtaking views throughout. Its difficulty and cultural appeal make it a major draw for marathon tourists.
ㅤ
4. Zermatt Marathon, Switzerland - 81.2 searches per finisher
The Zermatt Marathon swaps city streets for high Alpine terrain and over the 42.195 km course, runners gain around 1,800 metres of elevation, with the final stretch offering panoramic views of the iconic Matterhorn. It is widely regarded as one of the most physically demanding marathon routes in Europe, which means the participant list is small, but the places are highly sought after.
ㅤ
5. Boston Marathon, USA - 75.9 searches per finisher
As the world’s oldest annual marathon and one of the six World Marathon Majors, Boston has a level of prestige that naturally drives huge interest. Entry is tightly controlled through qualifying times and a competitive registration process, which keeps places limited despite global demand. Our data reflects this, with a high number of searches per finisher showing just how many runners hope to take part in one of the sport’s most iconic events.
ㅤ
The Most In-Demand Marathons in Europe
ㅤ

Photo credits: Benaja Germann (unsplash.com)
ㅤ
Europe remains a major destination for marathon travel, offering everything from fast city circuits to dramatic mountain climbs. Switzerland dominates the European ranking with two events in the top three, but the list also includes races in Croatia, Iceland and Ireland, showing that runners are increasingly interested in both established and emerging events.
ㅤ
The Top 15 Most In-Demand Marathons in Europe for 2025
| RANK & MARATHON NAME | LOCATION | FINISHERS IN LATEST EDITION | GOOGLE SEARCHES IN 2025 | DEMAND SCORE (SEARCHES PER FINISHER) |
| 1. Zermatt Marathon | Switzerland | 462 | 37,500 | 81.2 |
| 2. Lausanne Marathon | Switzerland | 1,851 | 127,100 | 68.7 |
| 3. Zagreb Marathon | Croatia | 656 | 43,200 | 65.9 |
| 4. Reykjavík Marathon | Iceland | 519 | 31,100 | 59.9 |
| 5. Midnight Sun Marathon | Norway | 1,570 | 85,100 | 54.2 |
| 6. Berlin Marathon | Germany | 17,100 | 890,900 | 52.1 |
| 7. Cork Marathon | Ireland | 1,942 | 99,000 | 51.0 |
| 8. Salzburg Marathon | Austria | 1,257 | 60,800 | 48.4 |
| 9. Helsinki City Marathon | Finland | 2,276 | 106,600 | 46.8 |
| 10. Graz Marathon | Austria | 1,138 | 49,180 | 43.2 |
| 11. Lyon Marathon | France | 5,145 | 214,200 | 41.6 |
| =12. Antwerp Marathon | Belgium | 4,017 | 158,400 | 39.4 |
| =12. Jungfrau Marathon | Switzerland | 3,452 | 136,100 | 39.4 |
| 14. Brussels Marathon | Belgium | 2,878 | 107,500 | 37.4 |
| 15. Isle of Wight Marathon | UK | 187 | 5,900 | 31.6 |
ㅤ
1. Zermatt Marathon, Switzerland - 81.2 searches per finisher
Zermatt offers a mountain focused marathon experience with long climbs, forested sections and high-altitude views. Its strong reputation among trail and alpine runners keeps its status as one of Europe’s most talked-about marathons, despite only 462 runners getting across the finish line in 2025.
ㅤ
2. Lausanne Marathon, Switzerland - 68.7 searches per finisher
Following the shoreline of Lake Geneva, the Lausanne Marathon features long stretches of clear water, quaint vineyards and distant Alpine views. Its scenic route and reliable autumn weather make it a popular choice for those seeking a panoramic but approachable Swiss marathon.
ㅤ
3. Zagreb Marathon, Croatia – 65.9 searches per finisher
Zagreb’s central start and finish and its straightforward city course have helped it draw more attention from international runners in recent years. The event has been growing steadily in visibility, offering a manageable, welcoming race weekend compared with the larger European marathons.
ㅤ
4. Reykjavík Marathon, Iceland – 59.9 searches per finisher
Iceland’s capital offers a striking route, with coastal sections, colourful neighbourhoods and views of the surrounding mountains. Its cool August conditions and relaxed race-day atmosphere make it an appealing course to runners who want a scenic marathon without extreme elevation.
ㅤ
5. Midnight Sun Marathon, Norway – 54.2 searches per finisher
Tromsø’s Midnight Sun Marathon is run late in the evening under full daylight, thanks to the Arctic summer sun. The unusual race time and dramatic fjord-and-mountain backdrop make it a standout choice for runners looking for a marathon that feels genuinely unique - that’s if you can get yourself a place.
ㅤ
Conclusion
Running continues to play an important role in how people across the UK look after both their physical and mental wellbeing. Interest in the sport remains strong, with many people either running regularly or considering starting in the year ahead. However, at the same time, our data shows that running is not yet something that feels equally accessible to everyone.
ㅤ
Supporting runners at every stage, from first jogs to bucket-list races, is key to encouraging more people to take part. This year at SportsShoes, we’ll doing this by launching our first flagship experiential store in London which will bring our expertise and running community spirit to the real world, alongside regularly updating our advice hub and producing tools that aim to help runners at any stage of their journey.
ㅤ
By helping to remove real and perceived barriers, running can continue to grow as an enjoyable activity for people of all ages and abilities.
ㅤ
Methodology
Survey and YouGov data
We partnered with Censuswide who surveyed 5,000 nationally representative UK consumers aged 18+ in the UK. The survey was conducted from a nationally representative of UK adults. Censuswide abide by and employ members of the Market Research Society which is based on the ESOMAR principles. Censuswide are also members of the British Polling Council. Data correct as of December 2025.
ㅤ
The number of runners in the UK, along with the gender, generation and location statistics, were calculated by just looking at those who say they do road, trail, track or cross country running – classing them as outdoor runners.
ㅤ
1* YouGov data from 18/01/2026
ㅤ
Most in demand marathon data
Based on a long list of global marathons, we pulled the number of finishers for each marathon from www.marathonview.net and then found the global annual search data for each marathon from Google Keyword Planner. The number of searches (which we took as demand) was then cross referenced with the number of finishers (which we took at supply) to find out which marathon was the most ‘in demand’. Data correct as of December 2025.
ㅤ
ㅤ
Interested in the latest shoes, apparel and technology? Then head over to our Kit & Gear category for more reviews, tips, advice and product releases.
Welcome
Welcome to SportsShoes Kit & Gear Hub! Here you'll find all the information and advice you need about the very latest kit, technology and gear.
Read More
Share this
Featured Articles
View All